


D. Tighe
Research expert covering consumer behavior, sporting goods retail, and the global toy industry.
Get in touch with us now
August 2023
United States
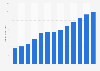
2010 to 2022
The release date is the date the information was accessed.
The American Customer Satisfaction Index (ACSI) scores on a 0-100 scale at the national level with 100 being the highest and best possible score. The ACSI is an economic indicator based on modeling of customer evaluations of the quality of goods and services purchased in the United States and produced by both domestic and foreign firms with substantial U.S. market shares. Subjects of investigation are 10 economic sectors, 47 industries (including e-commerce and e-business), more than 225 companies, and over 200 federal or local government services.
You only have access to basic statistics.
This statistic is not included in your account.
Business Solutions including all features.
Market overview
Trade
Retail & E-commerce
Leading companies
Consumer outlook
Further related statistics


