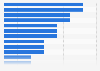


Distribution of NFL television audience during 2013 regular season, by income
This graph shows the distribution of the NFL regular season television audience in 2013, broken down by yearly income. The viewer group with an income of $40,000 to $75,000 per year comprised 32 percent of the regular season TV audience.


