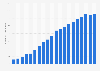
As of October 2021, analyst consensus is that that Apple would generate 5.73 U.S. dollars per share in 2023, a significant increase from the prediction of 3.24 U.S. dollars per share in 2021. These values are the mean of analysts' opinions for the period.
Street expectation of the earnings per share of Apple Inc from 2021 to 2023 (in U.S. dollars)
Basic Account
Get to know the platform
You only have access to basic statistics.
This statistic is not included in your account.
Starter Account
The ideal entry-level account for individual users
- Instant access to 1m statistics
- Download in XLS, PDF & PNG format
- Detailed references
$59 USD $39 USD / Month *
in the first 12 months
Professional Account
Full access
Corporate solution including all features.
* Prices do not include sales tax.
Statistics on Apple products in the U.S.
Overview: Apple
5
- Premium Statistic Apple's revenue worldwide 2004-2022
- Premium Statistic Apple's revenue broken down by operating segments 2012-2022, by quarter
- Premium Statistic Apple's revenue broken down by geographical region 2012-2022, by quarter
- Premium Statistic Apple: expenditure on research and development 2007-2022
- Premium Statistic Number of employees of Apple 2005-2022
Overview: Apple in the U.S.
5
- Basic Statistic Number of Apple stores in U.S. and Canada 2022
- Basic Statistic Number of Apple Stores by state in the U.S. 2022
- Basic Statistic U.S. lobbying expenses of Apple 2009-2022
- Premium Statistic Apple ad revenue in the U.S. 2020-2024
- Premium Statistic Apple ad revenue growth in the U.S. 2020-2024
Segment: iPhone
8
- Premium Statistic Quarterly market share of smartphone vendors in the U.S. 2016-2022
- Premium Statistic Share of mobile operating systems in the United States 2012-2022, by month
- Premium Statistic Mobile Apple iOS version market share in the United States 2017-2022
- Premium Statistic U.S. iPhone depreciation 5G capable 2022
- Premium Statistic U.S. iPhone depreciation non-5G capable in the United states 2022
- Premium Statistic Refurbished iPhones at Apple in the U.S. 2022, by retail price
- Premium Statistic Smartphone market share in the U.S. 2017-2022, by model
- Premium Statistic Apple iPhone smartphone users in the United States 2012-2022
Segment: iPad
4
- Premium Statistic Market share of tablet device vendors in the United States 2020-2022
- Premium Statistic Market share of tablet operating systems in the United States 2016-2022
- Premium Statistic Tablet Apple iOS version market share in the United States 2018-2022
- Premium Statistic Tablet ownership by brand in the U.S. 2022
Segment: Mac
4
- Premium Statistic PC vendor shipment share in the U.S. 2013-2022, by quarter
- Premium Statistic Market share held by PC operating systems in the U.S. 2012-2022, by month
- Premium Statistic Apple's PC unit shipment share in the U.S. 2013-2022, by quarter
- Premium Statistic Laptop ownership by brand in the U.S. 2022
Segment: Wearables & Apps
6
- Premium Statistic eHealth tracker / smart watch usage by brand in the U.S. 2022
- Premium Statistic Apple brand profile in the United States 2022
- Premium Statistic Leading iPhone apps in the U.S. 2022, by revenue
- Premium Statistic Leading iPhone apps in the U.S. 2022, by downloads
- Premium Statistic Leading iPad apps in the U.S. 2022, by revenue
- Premium Statistic Leading iPad apps in the U.S. 2022, by downloads
Further related statistics
17
- Forecast of EBITDA of Apple 2021-2023
- Forecast of street earnings of Apple quarterly 2021-2023
- Forecast of EBITDA of Apple quarterly 2021
- Forecast of mean EPS of Apple quarterly 2021-2023
- Forecasted quarterly EPS of Apple 2021-2022
- Dividend per share of Apple 2013-2021
- Apple Inc: net sales APAC 2013-2021
- Apple Inc: operating income APAC 2013-2021
- Apple product unit shipments worldwide 2013-2016
- Apple: brand value 2006-2022
- Apple iPad sales worldwide 2010-2018, by quarter
- U.S. consumer spending on digital media at Apple in the past 12 months 2017, by type
- Share of Apple iPad shipments by model in the United States 2017-2018
- Apple's total assets worldwide 2004-2022
- Connected objects owned by the French 2015
- U.S. consumers owning Apple devices 2017
- Amount of material recovered for reuse by Apple through take-back initiatives 2015
Further Content: You might find this interesting as well
Statistics
- Forecast of EBITDA of Apple 2021-2023
- Forecast of street earnings of Apple quarterly 2021-2023
- Forecast of EBITDA of Apple quarterly 2021
- Forecast of mean EPS of Apple quarterly 2021-2023
- Forecasted quarterly EPS of Apple 2021-2022
- Dividend per share of Apple 2013-2021
- Apple Inc: net sales APAC 2013-2021
- Apple Inc: operating income APAC 2013-2021
- Apple product unit shipments worldwide 2013-2016
- Apple: brand value 2006-2022
- Apple iPad sales worldwide 2010-2018, by quarter
- U.S. consumer spending on digital media at Apple in the past 12 months 2017, by type
- Share of Apple iPad shipments by model in the United States 2017-2018
- Apple's total assets worldwide 2004-2022
- Connected objects owned by the French 2015
- U.S. consumers owning Apple devices 2017
- Amount of material recovered for reuse by Apple through take-back initiatives 2015
Quandl. (October 25, 2021). Street expectation of the earnings per share of Apple Inc from 2021 to 2023 (in U.S. dollars) [Graph]. In Statista. Retrieved February 08, 2023, from https://www.statista.com/statistics/631805/forecast-of-street-earnings-of-apple/
Quandl. "Street expectation of the earnings per share of Apple Inc from 2021 to 2023 (in U.S. dollars)." Chart. October 25, 2021. Statista. Accessed February 08, 2023. https://www.statista.com/statistics/631805/forecast-of-street-earnings-of-apple/
Quandl. (2021). Street expectation of the earnings per share of Apple Inc from 2021 to 2023 (in U.S. dollars). Statista. Statista Inc.. Accessed: February 08, 2023. https://www.statista.com/statistics/631805/forecast-of-street-earnings-of-apple/
Quandl. "Street Expectation of The Earnings per Share of Apple Inc from 2021 to 2023 (in U.S. Dollars)." Statista, Statista Inc., 25 Oct 2021, https://www.statista.com/statistics/631805/forecast-of-street-earnings-of-apple/
Quandl, Street expectation of the earnings per share of Apple Inc from 2021 to 2023 (in U.S. dollars) Statista, https://www.statista.com/statistics/631805/forecast-of-street-earnings-of-apple/ (last visited February 08, 2023)
Street expectation of the earnings per share of Apple Inc from 2021 to 2023 (in U.S. dollars) [Graph], Quandl, October 25, 2021. [Online]. Available: https://www.statista.com/statistics/631805/forecast-of-street-earnings-of-apple/