Skip to main content
Consumer Goods & FMCG
E-Commerce
Economy & Politics
Energy & Environment
Health, Pharma & Medtech
Internet
Media
Technology & Telecommunications
Transportation & Logistics
Travel, Tourism & Hospitality
View all industries
Global data volume growth
Global AI market size
Number of generative AI users worldwide
Global inflation rate
Retail e-commerce sales worldwide
Largest economies worldwide
Biggest social media platforms by users
Global EV market share by manufacturer
International tourist arrivals by world region
Global annual CO₂ emissions
Browse recent statistics
Artificial intelligence (AI) worldwide
TikTok
Nvidia
E-commerce worldwide
Global GDP
Instagram
Apparel market worldwide
Video gaming worldwide
Global renewable energy industry
Influencer marketing worldwide
Browse recent topics
Consumer Trends 2026
Artificial Intelligence: in-depth market analysis
E-commerce challenges
Global economy
TikTok
Luxury goods: in-depth market analysis
Electric vehicles: A global overview
Video gaming worldwide
Travel and tourism trends 2026
Battery recycling worldwide
Browse recent reports
Explore the tool
Explore Classic mode
Advertising & Media
eCommerce
Consumer
Finance
Global Indicators
Health
Industrial
Mobility
Technology
Explore Market Insights
eCommerce Insights
Research AI
Book a demo
All integrations
Developer docs
Explore Statista Connect
Research
Strategy & Consulting
Marketing
Media & PR
Explore AI assistants
Marketing
Research & Development
Strategy
Sales
Find the fact
Tell the story
Win the pitch
Understand the market
Develop your strategy
Academia
Agencies
Consultancies
Consumer goods
Finance
Tech
Research solutions
Strategy consulting
Communication services
Explore Statista+
Statista R
Statista Healthcare
About Statista
First steps & help center
Webinar & training hub
Success stories
Individuals & Small Teams
Businesses & Enterprises
Academia & Government
English
Deutsch
Daily Data
Infographics on the topic "uk"
News Consumption
Jun 17, 2026
This chart shows the share of respondents who sometimes/often actively avoid the news.
More Information
AI & News
Jun 17, 2026
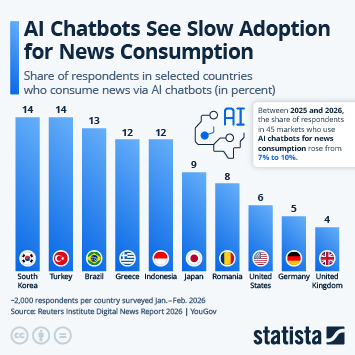
This chart shows the share of respondents in selected countries who consume news via AI chatbots.
More Information
Sponsored by Booking.com
Jun 15, 2026
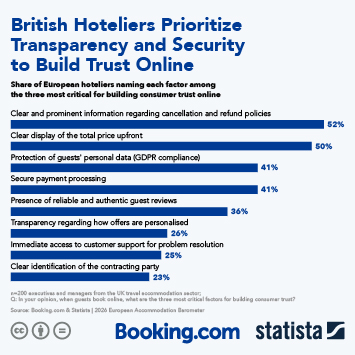
This infographic shows the share of UK accommodations that picked top factors most critical for building consumer trust online.
More Information
Society
Jun 9, 2026
This chart shows the total weeks of paid leave available to mothers (full-rate equivalent).
More Information
Allergies
Jun 2, 2026
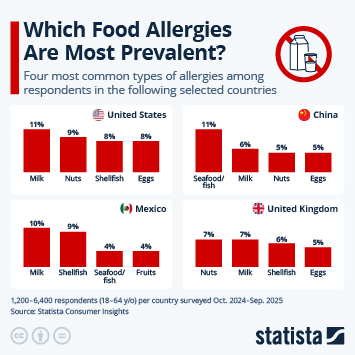
This chart shows the four most common types of allergies among respondents in the following selected countries.
More Information
Sports
Jun 2, 2026
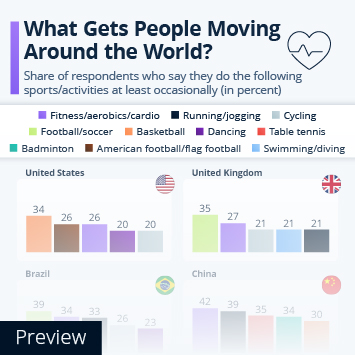
This chart shows the share of respondents who say they do the following sports/activities at least occasionally in four countries.
More Information
Vaccination
May 29, 2026
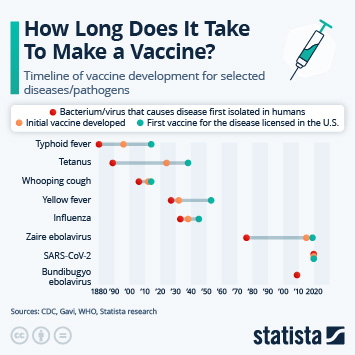
This chart shows the timeline of vaccine development for selected diseases/pathogens.
More Information
Travel & tourism
May 29, 2026
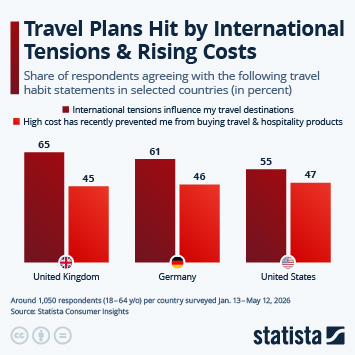
This chart shows the share of respondents agreeing with the following travel habit statements in the United States, the UK and Germany...
More Information
Employment
May 28, 2026
This chart shows the share of respondents saying they hadn't taken a sick day in the previous 12 months in selected countries.
More Information
Pride Month
May 21, 2026
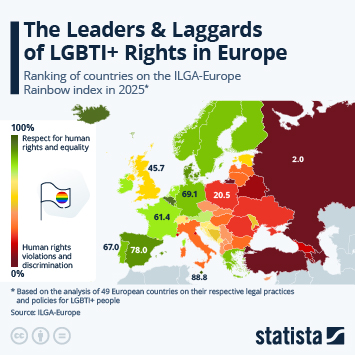
This chart shows the ranking of countries on the ILGA-Europe Rainbow Map in 2026.
More Information
Employment
May 15, 2026
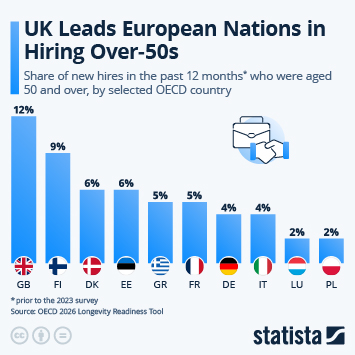
This chart shows the share of new hires in the past 12 months who were aged 50 and over, by selected OECD country.
More Information
Podcasts
May 12, 2026
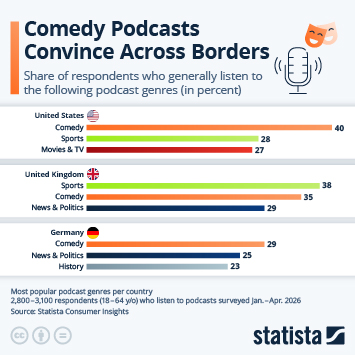
This infographic shows the most popular podcast genres in a selection of countries.
More Information
world patient safety day
May 5, 2026
This chart shows the share of respondents who undergo regular medical check-ups in selected countries (in percent).
More Information
News
Apr 29, 2026
This chart shows the share of respondents who do not trust the mainstream media in their country of residence (in %).
More Information
Nuclear Risks
Apr 24, 2026
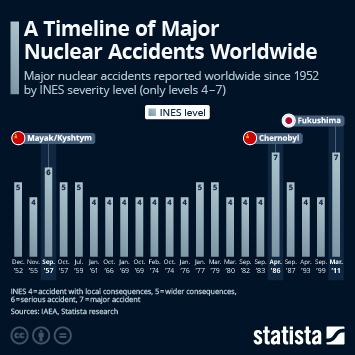
This infographic shows the major nuclear accidents reported worldwide since 1952 (INES severity levels 4–7).
More Information
Streaming
Apr 16, 2026
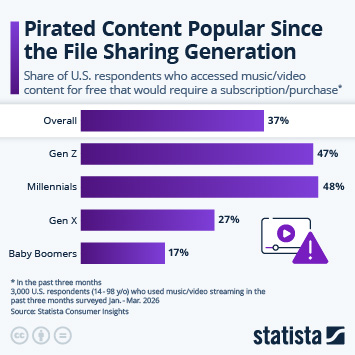
This chart shows the share of U.S. respondents who accessed music/video content for free that would require a subscription/purchase.
More Information
Global Inflation
Apr 16, 2026
This chart shows the share of respondents who believe that inflation is one of the most important problems in their country.
More Information
Chocolate
Apr 2, 2026
This chart shows per capita chocolate consumption in selected countries in 2026 (in kilograms).
More Information
Sports Betting
Mar 26, 2026
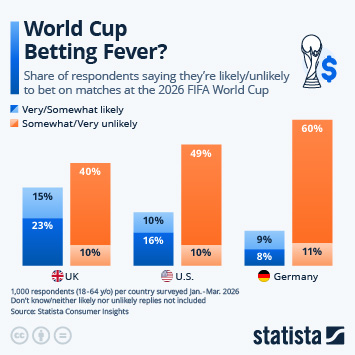
This chart shows how likely respondents from the UK, the U.S. and Germany said they are to bet on matches at the upcoming FIFA World...
More Information
Gas Prices
Mar 25, 2026
This chart shows the price of one gallon of gasoline, by country/territory (as of March 23, 2026).
More Information
Artificial Intelligence
Mar 25, 2026
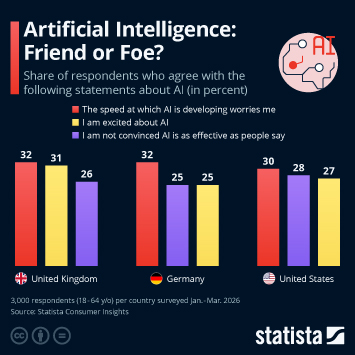
This infographic shows the share of respondents in selected countries who agree with a selection of statements on AI (in percent).
More Information
Music industry
Mar 23, 2026
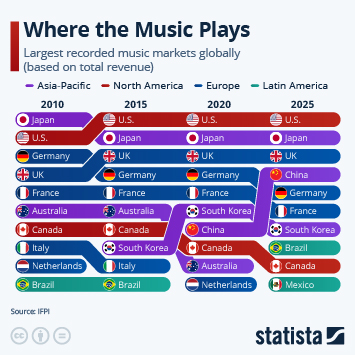
This chart shows the world's largest recorded music markets based on revenue.
More Information
Iran War
Mar 9, 2026
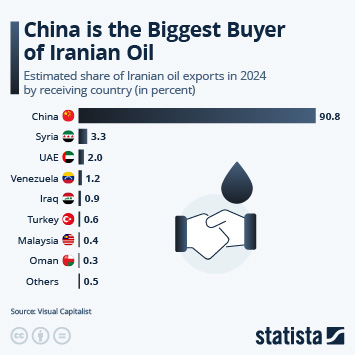
This infographic details the estimated share of Iran oil exports in 2024 by receiving country (in percent).
More Information
Services Trade
Feb 25, 2026
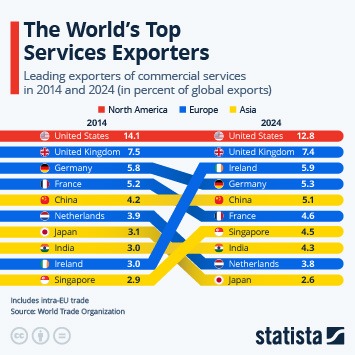
This infographic compares the leading exporters of commercial services in 2014 and 2024 (in percent of global exports).
More Information
Artificial Intelligence
Feb 10, 2026
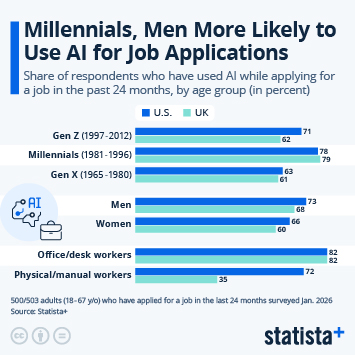
This infographic shows the share of respondents who have used AI while applying for a job in the past 24 months.
More Information
Artificial Intelligence
Feb 10, 2026
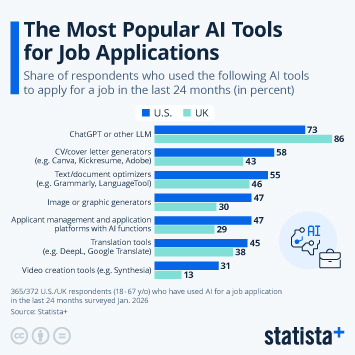
This infographic shows the share of respondents who used a selection of AI tools to apply for a job in the last 24 months (in percent).
More Information
Artificial Intelligence
Feb 10, 2026
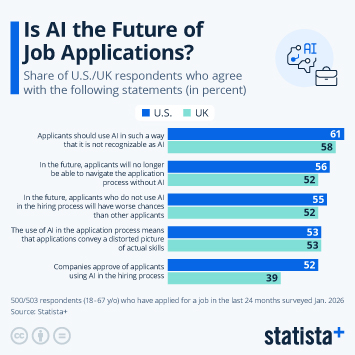
This infographic shows the share of U.S./UK respondents who agree with a selection of statements (in percent).
More Information
U.S.-Greenland dispute
Jan 20, 2026
This chart shows what Americans think of a potential U.S. annexation of Greenland.
More Information
Artificial intelligence
Jan 19, 2026
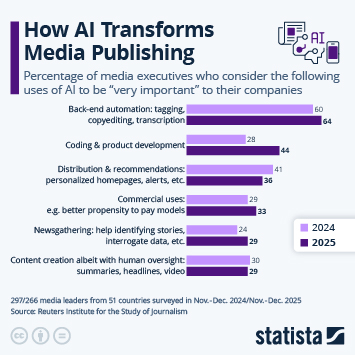
This chart shows the percentage of media executives who consider the following uses of AI to be "very important" to their companies...
More Information
Society
Jan 19, 2026
This chart shows the share of respondents who say 'socializing' is one of their personal hobbies.
More Information
2
/
25
Contact
Get in touch with us. We are happy to help.
Do you still have questions?
Feel free to contact us anytime using our
contact form
or visit our
FAQ page
.
Your contact to the Infographics Newsroom
Felix Richter
Data Journalist
felix.richter@statista.com
+49 (40) 284 841 557