Skip to main content
Consumer Goods & FMCG
E-Commerce
Economy & Politics
Energy & Environment
Health, Pharma & Medtech
Internet
Media
Technology & Telecommunications
Transportation & Logistics
Travel, Tourism & Hospitality
View all industries
Global data volume growth
Global AI market size
Number of generative AI users worldwide
Global inflation rate
Retail e-commerce sales worldwide
Largest economies worldwide
Biggest social media platforms by users
Global EV market share by manufacturer
International tourist arrivals by world region
Global annual CO₂ emissions
Browse recent statistics
Artificial intelligence (AI) worldwide
TikTok
Nvidia
E-commerce worldwide
Global GDP
Instagram
Apparel market worldwide
Video gaming worldwide
Global renewable energy industry
Influencer marketing worldwide
Browse recent topics
Consumer Trends 2026
Artificial Intelligence: in-depth market analysis
E-commerce challenges
Global economy
TikTok
Luxury goods: in-depth market analysis
Electric vehicles: A global overview
Video gaming worldwide
Travel and tourism trends 2026
Battery recycling worldwide
Browse recent reports
Explore the tool
Explore Classic mode
Advertising & Media
eCommerce
Consumer
Finance
Global Indicators
Health
Industrial
Mobility
Technology
Explore Market Insights
eCommerce Insights
Research AI
Book a demo
All integrations
Developer docs
Explore Statista Connect
Research
Strategy & Consulting
Marketing
Media & PR
Explore AI assistants
Marketing
Research & Development
Strategy
Sales
Find the fact
Tell the story
Win the pitch
Understand the market
Develop your strategy
Academia
Agencies
Consultancies
Consumer goods
Finance
Tech
Research solutions
Strategy consulting
Communication services
Explore Statista+
Statista R
Statista Healthcare
About Statista
First steps & help center
Webinar & training hub
Success stories
Individuals & Small Teams
Businesses & Enterprises
Academia & Government
English
Deutsch
Daily Data
Infographics on the topic "uk"
Climate change
Jan 14, 2026
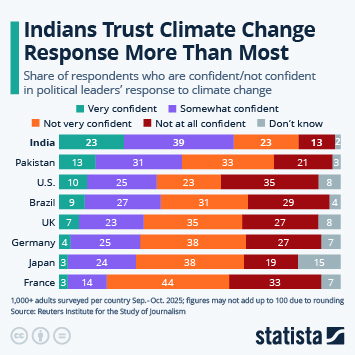
This infographic shows the share of respondents in selected countries who are confident/not confident that political leaders are making...
More Information
Climate change
Jan 14, 2026
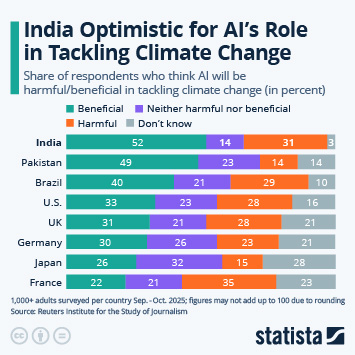
This infographic shows the share of respondents in selected countries who think AI will be harmful/beneficial in tackling climate change...
More Information
U.S. Operations in Venezuela
Jan 9, 2026
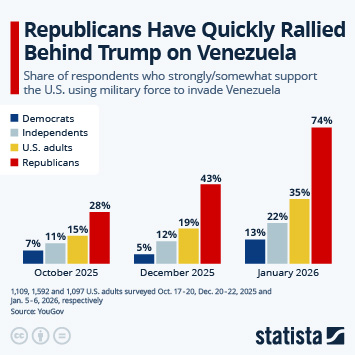
This chart shows what Americans think about U.S. military action in Venezuela.
More Information
Tesla
Jan 8, 2026
This chart compares Tesla's sales growth in Europe with the overall BEV sales growth since Q1 2024.
More Information
Dry January
Jan 7, 2026
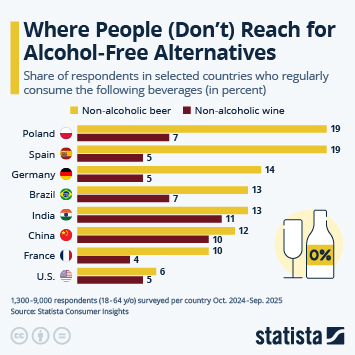
This infographic shows the share of respondents in selected countries who regularly consume non-alcoholic beer or wine.
More Information
Alcohol
Dec 17, 2025
This chart shows the biggest champagne importers worldwide in 2024.
More Information
TV
Dec 8, 2025
This chart shows the share of respondents who watch TV for at least 11 hours per week in selected countries.
More Information
Surface Sealing
Dec 5, 2025
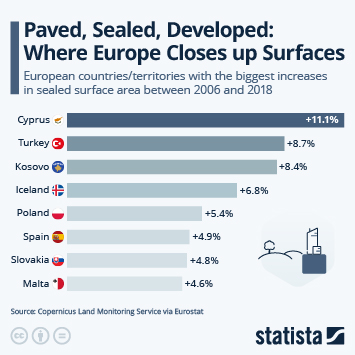
This chart shows the European countries/territories with the biggest increases in sealed surface area between 2006 and 2018.
More Information
New Year's Eve
Dec 5, 2025
This chart shows the share of respondents who say that firworks and firecrackers are an essential part of a New Year's celebration.
More Information
Christmas songs
Dec 4, 2025
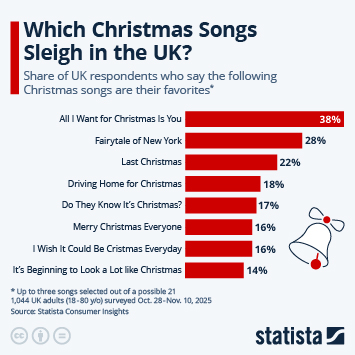
This chart shows the share of UK respondents who say the following Christmas songs are their favorites.
More Information
Tax
Dec 4, 2025
This chart shows the Corporate Tax Haven Index score of the world's most damaging corporate tax havens in 2025.
More Information
Print industry
Nov 26, 2025
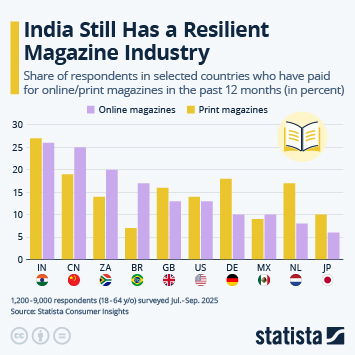
This chart shows the share of respondents in selected countries who have paid for online/print magazines in the past 12 months (in...
More Information
Print Advertising
Nov 26, 2025
This chart shows estimated print advertising revenue in the United States.
More Information
Internet access
Nov 24, 2025
This chart shows the share of people that "borrow" their neighbor's WiFi.
More Information
Trust
Nov 17, 2025
This chart shows how many people trust politicians, journalists, police officers and scientists in selected countries.
More Information
Edelman
Nov 14, 2025
This chart shows the share of people that trust their national government in selected countries in 2024.
More Information
Fake news
Nov 14, 2025
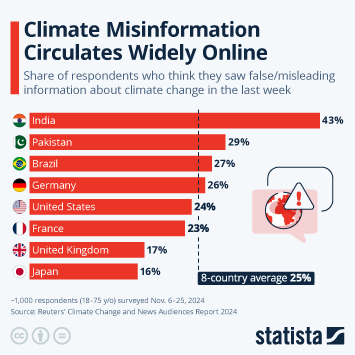
This chart shows the share of respondents who think they saw fake/misleading information about climate change in the last week.
More Information
E-Commerce
Nov 11, 2025
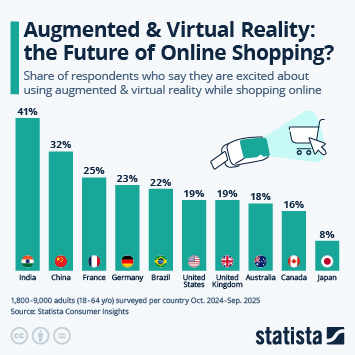
This chart shows the share of respondents in selected countries who say they are excited about using Augmented & Virtual Reality while...
More Information
Economy
Oct 30, 2025
This chart shows central banks' main policy interest rates in the United States and Europe.
More Information
Investment behavior
Oct 29, 2025
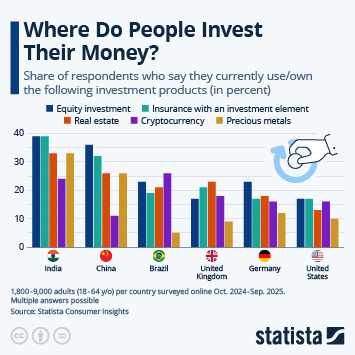
This chart shows the share of respondents in selected countries who say they currently use/own the following investment products (in...
More Information
Netflix
Oct 22, 2025
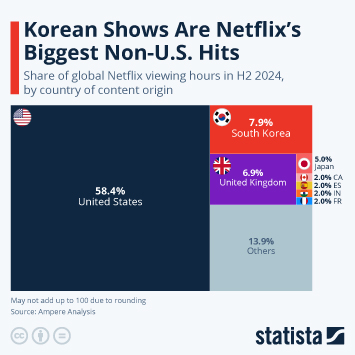
This chart shows the share of global Netflix viewing hours in H2 2024, by country of content origin.
More Information
Politics
Oct 16, 2025
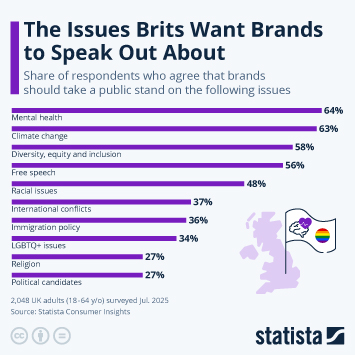
This chart shows the share of respondents who agree that brands should take a public stand on various issues.
More Information
British Monarchy
Sep 16, 2025
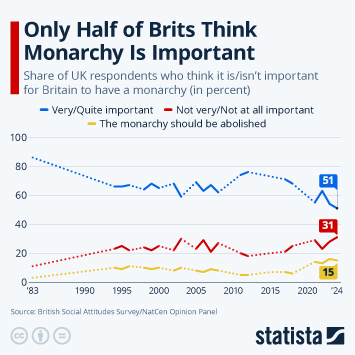
This chart shows the share of UK respondents who think it is/isn't important for Britain to have a monarchy.
More Information
Trump Travels
Sep 16, 2025
This chart shows the countries/territories visited by U.S. President Donald Trump on official trips 2017-2020 and 2025.
More Information
Education
Sep 15, 2025
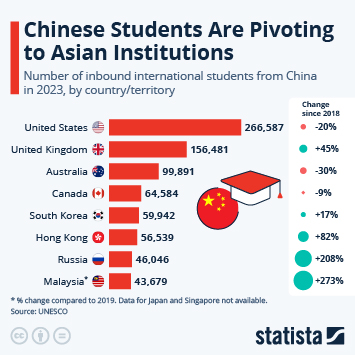
This chart shows the number of inbound international students from China in 2023, by country/territory.
More Information
Solar
Sep 3, 2025
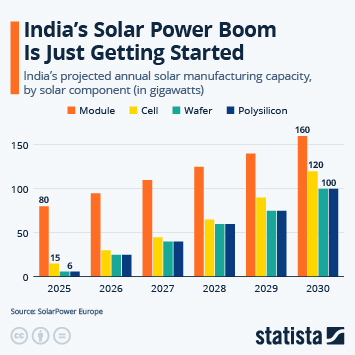
This chart shows India's projected annual solar manufacturing capacity, by solar component (in GW).
More Information
Ukraine Aid
Aug 18, 2025
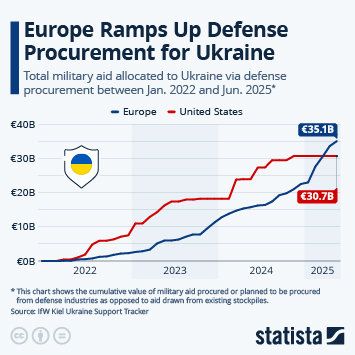
This chart shows the cumulative value of military aid allocated to Ukraine and procured via new defense contracts.
More Information
International Day against Nuclear Tests
Aug 5, 2025
This chart shows estimated global nuclear warhead inventories in 2024.
More Information
Earthquakes
Jul 31, 2025
This chart shows the strongest known earthquakes by magnitude (MMS).
More Information
EV
Jul 28, 2025
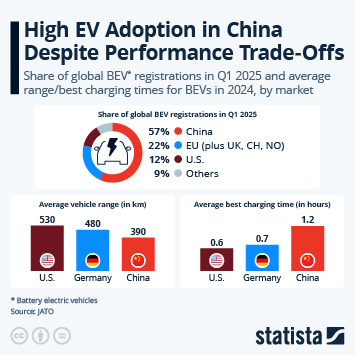
This chart shows the share of global BEV* registrations in Q1 2025 and average range/best charging times for BEVs in 2024, by market.
More Information
Sustainability
Jul 23, 2025
This chart shows the historical dates of Earth Overshoot Day from 1970 to 2025.
More Information
Palantir
Jul 22, 2025
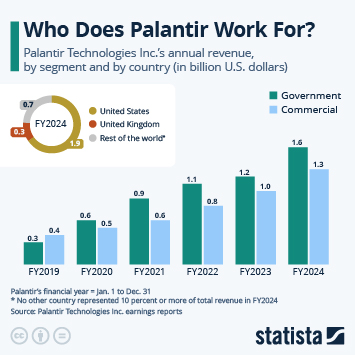
This chart shows Palantir Technologies Inc.'s annual revenue by segment and by country (in billion U.S. dollars).
More Information
Development Aid
Jul 21, 2025
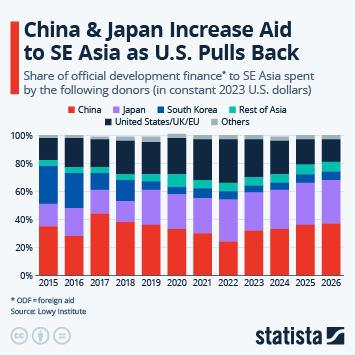
This chart shows the share of official development finance to Southeast Asia spent by various donors.
More Information
Tax
Jul 15, 2025
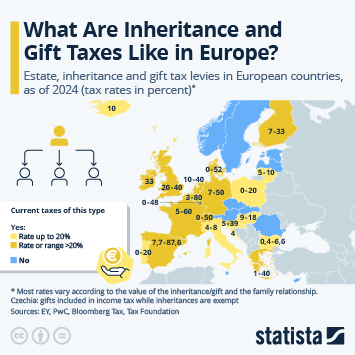
This chart shows estate, inheritance and gift tax levies in European countries, as of 2024.
More Information
Climate Change
Jul 10, 2025
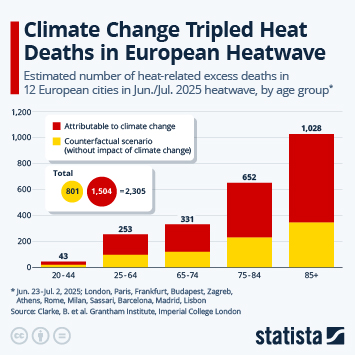
This chart shows the estimated number of excess heat-related deaths in the June/July 2025 European heatwave and the impact of climate...
More Information
Deportations
Jul 8, 2025
This chart shows the countries the U.S. has asked/plans to ask to take deportees who are not their citizens.
More Information
Health
Jul 3, 2025
This chart shows the reported Lyme disease incidence in the United States in 2022 (per 100,000) people.
More Information
Reuters Institute
Jul 2, 2025
This chart shows the share of respondents who used the following social media networks for news in the past week (in percent).
More Information
Smoking
Jul 2, 2025
This chart shows major tobacco bans or similar legislation and state of implementation worldwide (as of July 2025).
More Information
Chinese Car Exports
Jun 30, 2025
This chart shows automobile exports from China (in million units).
More Information
Car Safety
Jun 26, 2025
This chart shows the effectiveness of automatic emergency braking systems at various speeds.
More Information
Wealth tax
Jun 25, 2025
This chart shows the share of surveyed G20 millionaires who said they supported additional wealth taxes (in percent).
More Information
Oil
Jun 23, 2025
This chart shows the evolution of the average price per barrel of crude oil (in U.S. dollars).
More Information
News
Jun 17, 2025
This chart shows the share of respondents who say they actively try to avoid the news because of various reasons (in %).
More Information
Airlines
Jun 17, 2025
This chart shows the age of the fleet of selected, major airlines (in years).
More Information
Shopping Behavior
May 22, 2025
The chart shows the share of respondents in selected countries who said they often end up buying clothes they never wear.
More Information
Food Allergies
May 15, 2025
This chart shows the share of respondents from selected countries who said they had/didn't have a food intolerance (in percent).
More Information
VE Day
May 8, 2025
This chart shows the estimated number of living U.S. WWII veterans from 2015 to 2044.
More Information
European Defense
May 8, 2025
This chart shows what Europeans and Americans perceive as major threats to peace in Europe.
More Information
Fast Fashion
Apr 28, 2025
This chart shows the share of respondents from selected countries who avoid buying fast fashion.
More Information
AI Tools
Apr 24, 2025
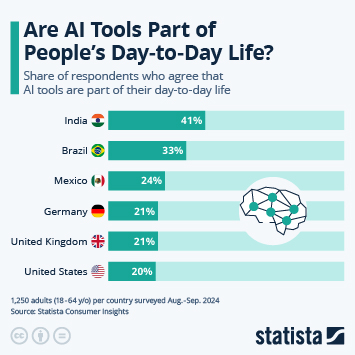
This chart shows how many people in selected countries say that AI tools are part of their day-to-day lives.
More Information
Tesla
Apr 16, 2025
This chart shows year-on-year change in new Tesla registrations in the first quarter of 2025, by country (in %).
More Information
Trade
Apr 9, 2025
This chart shows India's total import value of motor cars and other motor vehicles in 2023/24, by source country.
More Information
Travel restrictions
Apr 2, 2025
This chart shows the share of respondents who adjust their travel plans on the basis of travel requirements and government regulations.
More Information
Cancel Culture
Mar 28, 2025
This chart shows the share of U.S. respondents who would take action against a brand for the following reasons (in percent).
More Information
Syria
Mar 14, 2025
This chart shows Syria's oil production (in 1,000 barrels per day).
More Information
Military aid to Ukraine
Mar 7, 2025
This chart shows the amounts of military aid allocated to Ukraine between January 2022 and December 31, 2024.
More Information
Media
Feb 26, 2025
This chart shows the share of respondents who have used newspapers, radio and linear TV in the last four weeks.
More Information
German Election
Feb 21, 2025
This chart shows the age composition of eligible voters in the German federal election on February 2025.
More Information
German 2025 elections
Feb 18, 2025
This chart shows the AfD's share of the vote in recent and upcoming German federal elections.
More Information
Tourism
Feb 17, 2025
This chart shows the share of respondents who think that their local area receives too many international tourists.
More Information
Sponsored post by Booking.com
Feb 11, 2025
This infographic shows consumer sentiment on hotels' right to adjust prices during busy periods, by country.
More Information
Spotify
Feb 7, 2025
This chart shows the long-term user growth of music streaming service Spotify.
More Information
Sponsored post by booking.com
Feb 7, 2025
This infographic shows the share of consumers who intend to travel internationally, by country of origin.
More Information
Education
Jan 24, 2025
This chart shows a distribution of universities in the top 30 of the 'World University Ranking 2024', by country.
More Information
Education
Jan 24, 2025
This chart shows the overall score given to the world's highest ranked universities.
More Information
Arctic
Jan 24, 2025
This chart shows military bases in the Arctic belonging to NATO and Russia.
More Information
Edelman Trust Barometer
Jan 22, 2025
This chart shows the share of respondents who would approve of various methods of hostile activism to drive social change.
More Information
UK ETA
Jan 9, 2025
This chart shows the nationalities that will have to purchase a UK Electronic Travel Authorization for trips, by start date.
More Information
Society
Dec 13, 2024
This chart shows the share of adults saying they plan to go to church/to the pub on Christmas day in 2024.
More Information
Education
Dec 2, 2024
This chart shows the top concern among respondents for the greatest challenges facing the education system in their country (in %).
More Information
binge-drinking
Nov 29, 2024
This chart shows the percentage who have had an episode of heavy drinking in the past 30 days.
More Information
Food
Nov 25, 2024
This chart shows the top three cuisines preferred by respondents in a selection of countries (in percent).
More Information
LGBTQI+
Nov 22, 2024
This chart shows the share of UK adults who described their sexuality in different ways, by generation (in %).
More Information
Net Zero
Nov 11, 2024
This chart shows the quality of net-zero targets, by share of global emissions covered (in percent).
More Information
2024 U.S. Presidential Election
Nov 5, 2024
This chart shows the share of European respondents who think there would be violence in the U.S. if Trump is not elected.
More Information
Corporate Minimum Tax
Oct 1, 2024
This chart shows 2023 effective average corporate tax rates in jurisdictions where multinationals' taxes are expected to rise.
More Information
music streaming
Sep 30, 2024
This chart shows the share UK and U.S. respondents that have used the following audio streaming services in the past year.
More Information
Financial Industry
Sep 24, 2024
This chart shows index ratings for selected global financial centers in 2014 and 2024 (1,000=most competitive).
More Information
Society
Sep 17, 2024
This chart shows the oldest existing constitutions in the world by year of creation.
More Information
Sustainability survey
Sep 11, 2024
This chart shows the share of respondents who say it is acceptable to break the law to protect the environment.
More Information
World Skyscraper Day
Sep 3, 2024
This chart shows the tallest buildings worldwide.
More Information
Afghanistan
Sep 2, 2024
This chart shows the number of people deported from Germany to Afghanistan per year.
More Information
International Day against Nuclear Tests
Aug 29, 2024
This chart shows the European military bases where nuclear weapons are stationed.
More Information
Demography
Aug 26, 2024
This chart shows the age and place of birth of the oldest living people in the world.
More Information
Civil rights
Aug 23, 2024
This chart shows the share of respondents who say that civil rights are one of the most important issues in their country
More Information
Driving
Aug 15, 2024
This chart shows countries by left-hand and right-hand traffic.
More Information
Medical coverage
Aug 14, 2024
This chart shows the number of medical doctors per 10,000 people in the world's biggest economies.
More Information
Prisoner Swap
Aug 2, 2024
This chart shows major prisoner swaps between Washington and Moscow since 1962 and notable prisoners.
More Information
UNESCO World Heritage
Jul 31, 2024
This chart shows cultural UNESCO World Heritage sites listed as "in danger" and year they were added to that list.
More Information
3
/
25
Contact
Get in touch with us. We are happy to help.
Do you still have questions?
Feel free to contact us anytime using our
contact form
or visit our
FAQ page
.
Your contact to the Infographics Newsroom
Felix Richter
Data Journalist
felix.richter@statista.com
+49 (40) 284 841 557