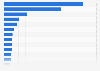
This statistic displays the results of a survey conducted in 2017 on internet users who were streaming with or without short video clips, divided by frequency. 28 percent of respondents streamed without short clips one to four days a week. 36 percent of respondents streamed with short clips daily or almost daily.
Share of individuals who stream online with and without short video clips in Denmark in 2017, by frequency
Basic Account
Get to know the platform
You only have access to basic statistics.
This statistic is not included in your account.
Starter Account
The ideal entry-level account for individual users
- Instant access to 1m statistics
- Download in XLS, PDF & PNG format
- Detailed references
$59 USD $39 USD / Month *
in the first 12 months
Professional Account
Full access
Corporate solution including all features.
* Prices do not include sales tax.
Statistics on Internet usage in Vietnam
Overview
5
- Premium Statistic Online population APAC 2022, by country
- Premium Statistic Internet users in Vietnam 2013-2028
- Premium Statistic Internet penetration forecast in Vietnam 2013-2028
- Premium Statistic Mobile internet users in Vietnam 2013-2028
- Premium Statistic Internet households in Vietnam 2013-2028
Usage behavior
6
- Premium Statistic Daily time spent using internet APAC 2021, by country or region
- Premium Statistic Daily time spent using online media in Vietnam 2021, by activity
- Premium Statistic Leading internet activities Vietnam 2021
- Premium Statistic Distribution of internet traffic in Vietnam 2021, by device
- Premium Statistic Most common Google search queries based on index Vietnam 2021
- Premium Statistic Most-visited websites based on number of pages per visit Vietnam 2021
Browsers and search engines
6
- Basic Statistic Share of Chrome in browser market in Vietnam 2011-2022
- Basic Statistic Share of Coc Coc in browser market in Vietnam 2013-2022
- Basic Statistic Share of Safari in browser market in Vietnam 2011- 2022
- Basic Statistic Share of Firefox in browser market in Vietnam 2011-2022
- Basic Statistic Share of Opera in browser market in Vietnam 2011-2022
- Premium Statistic Market share of search engines in Vietnam 2022
Mobile internet and apps
5
- Premium Statistic Share of population covered by 2G, 3G, and 4G mobile networks in Vietnam 2017-2020
- Premium Statistic Number of mobile subscribers generating data traffic in Vietnam 2016-2020
- Premium Statistic Market share of terrestrial mobile-cellular service providers Vietnam 2020
- Premium Statistic Number of mobile apps downloaded Vietnam 2018-2021
- Premium Statistic Consumer expenditures on mobile apps Vietnam 2018-2021
Social media
7
- Premium Statistic Social media users in Vietnam 2019-2028
- Premium Statistic Leading social media apps in Vietnam in Q1 2022
- Premium Statistic Leading primary social media apps in Vietnam in Q1 2022
- Premium Statistic Primary social media platforms among Generation Z in Vietnam in Q1 2022
- Premium Statistic Share of TikTok users among Gen Z Vietnam Q1 2020-Q 2022
- Premium Statistic Daily time spent using social networks Vietnam Q2 2018-Q3 2021
- Premium Statistic Main reasons for using social networks Vietnam Q3 2021
E-commerce
7
- Premium Statistic E-commerce market value in Vietnam 2014-2021
- Premium Statistic Number of people buying consumer goods online Vietnam 2019-2021
- Premium Statistic Consumer goods e-commerce spending in Vietnam 2021, by category
- Premium Statistic Penetration rates of e-commerce channels Vietnam 2022
- Premium Statistic Leading international B2C e-commerce sites in Vietnam Q1 2022, by monthly visits
- Premium Statistic Leading domestic B2C e-commerce sites in Vietnam Q1 2022, by monthly visits
- Premium Statistic Share of e-commerce activities of internet users in Vietnam 2021
Digital payments
6
- Premium Statistic Digital payment transaction value in Vietnam 2017-2025, by segment
- Premium Statistic Digital payment users in Vietnam 2017-2025, by segment
- Premium Statistic Consumer preferences for digital versus traditional banks Vietnam 2021
- Premium Statistic Opinion towards cashless payments among Vietnamese 2021
- Premium Statistic Most used digital payment methods among Vietnamese 2021
- Premium Statistic Digital banking services usage during COVID and future usage intention Vietnam 2021
Further related statistics
11
- Frequency of streaming movies in France 2018
- Frequency of streaming music in France 2018
- Number of internet users per 1,000 people in China 2000-2015
- Number of households without internet access in Italy in 2019, by reason
- Internet usage among individuals in Italy 2020, by gender
- Share of Facebook male users in Italy 2018, by frequency
- Share of female Facebook users in Italy 2018, by frequency
- UAE's number of first year internet users 2000-2016
- Number of internet users in Bangladesh 2005-2016
- Share of male YouTube users in Italy 2018, by frequency
- Reasons to access the internet in rural India 2016
Further Content: You might find this interesting as well
Statistics
- Frequency of streaming movies in France 2018
- Frequency of streaming music in France 2018
- Number of internet users per 1,000 people in China 2000-2015
- Number of households without internet access in Italy in 2019, by reason
- Internet usage among individuals in Italy 2020, by gender
- Share of Facebook male users in Italy 2018, by frequency
- Share of female Facebook users in Italy 2018, by frequency
- UAE's number of first year internet users 2000-2016
- Number of internet users in Bangladesh 2005-2016
- Share of male YouTube users in Italy 2018, by frequency
- Reasons to access the internet in rural India 2016
Slots- og Kulturstyrelsen. (June 20, 2018). Share of individuals who stream online with and without short video clips in Denmark in 2017, by frequency [Graph]. In Statista. Retrieved February 09, 2023, from https://www.statista.com/statistics/1006523/frequency-of-streaming-online-with-without-video-clips-in-denmark/
Slots- og Kulturstyrelsen. "Share of individuals who stream online with and without short video clips in Denmark in 2017, by frequency." Chart. June 20, 2018. Statista. Accessed February 09, 2023. https://www.statista.com/statistics/1006523/frequency-of-streaming-online-with-without-video-clips-in-denmark/
Slots- og Kulturstyrelsen. (2018). Share of individuals who stream online with and without short video clips in Denmark in 2017, by frequency. Statista. Statista Inc.. Accessed: February 09, 2023. https://www.statista.com/statistics/1006523/frequency-of-streaming-online-with-without-video-clips-in-denmark/
Slots- og Kulturstyrelsen. "Share of Individuals Who Stream Online with and without Short Video Clips in Denmark in 2017, by Frequency." Statista, Statista Inc., 20 Jun 2018, https://www.statista.com/statistics/1006523/frequency-of-streaming-online-with-without-video-clips-in-denmark/
Slots- og Kulturstyrelsen, Share of individuals who stream online with and without short video clips in Denmark in 2017, by frequency Statista, https://www.statista.com/statistics/1006523/frequency-of-streaming-online-with-without-video-clips-in-denmark/ (last visited February 09, 2023)
Share of individuals who stream online with and without short video clips in Denmark in 2017, by frequency [Graph], Slots- og Kulturstyrelsen, June 20, 2018. [Online]. Available: https://www.statista.com/statistics/1006523/frequency-of-streaming-online-with-without-video-clips-in-denmark/