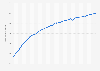
In the third quarter of the year 2021,online consumers in the Asia-Pacific region spent on average a little over two hours per day using social media. This was a slight drop compared to the time spent on social media over the region in the previous quarter of that same year.
Average time spent using social media by online consumers in the Asia-Pacific region from third quarter of 2019 to third quarter of 2021 (in hours and minutes)
Basic Account
Get to know the platform
You only have access to basic statistics.
This statistic is not included in your account.
Starter Account
The ideal entry-level account for individual users
- Instant access to 1m statistics
- Download in XLS, PDF & PNG format
- Detailed references
$59 USD $39 USD / Month *
in the first 12 months
Professional Account
Full access
Business Solutions including all features.
* Prices do not include sales tax.
Statistics on Social media in the Asia-Pacific region
Overview
4
- Premium Statistic Social media: global penetration rate 2023, by region
- Premium Statistic Active social media user penetration APAC 2022, by country
- Premium Statistic Number of active social media users APAC 2022, by country
- Premium Statistic Average time spent online by consumers on social media APAC 2019-2021
Key platforms
7
- Premium Statistic Social media market share Asia 2022, by platform
- Premium Statistic Mobile social media market share Asia 2022, by platform
- Premium Statistic Facebook monthly market share Asia 2022-2023
- Premium Statistic Twitter monthly market share Asia 2022-2023
- Premium Statistic Instagram monthly market share Asia 2022-2023
- Premium Statistic YouTube monthly market share Asia 2022-2023
- Premium Statistic Most popular social media in China Q3 2022
Meta
3
YouTube
4
- Premium Statistic Distribution of YouTube channels Asia November 2021, by category
- Premium Statistic Average number of subscribers of YouTube channels Asia November 2021, by category
- Premium Statistic Average views per subscriber of YouTube channels Asia 2021, by category
- Premium Statistic Average views per video of YouTube channels Asia 2021, by category
APAC platforms
4
Content creators
4
Consumer behavior
5
- Premium Statistic Daily time spent spent using social media APAC 2021, by country
- Premium Statistic Average number of social media platforms used per internet user APAC 2021, by country
- Premium Statistic Share of internet users using social media for work APAC 2021, by country
- Premium Statistic Intention to shop on social media platforms APAC 2021, by country
- Premium Statistic Interest in social media commerce integration SEA 2020, by country
Further related statistics
21
- Share of daily social media usage in Finland 2022, by gender
- Share of daily social media usage Finland 2022, by platform
- Social media usage in enterprises in Finland 2013-2022, by activity
- Reasons for social media usage UAE 2022
- Social media user growth Saudi Arabia 2014 - 2022
- Social media user growth UAE 2014-2022
- Forecast of the social media user penetration rate in Finland 2020-2030
- Reasons for social media usage Saudi Arabia 2022
- Leading social media usage reasons worldwide 2022
- Leading social media usage reasons in Italy 2022
- Frequency of social media usage in Czechia 2022
- Forecast of social media user numbers in Finland 2020-2030
- Social media user gender distribution in Ukraine 2023, by platform
- Average social media usage time per weekday Japan FY 2012-2021
- Daily social media usage in South Africa Q1 2017- Q3 2021
- Daily social media usage in Egypt Q1 2017- Q3 2021
- Daily social media usage in Africa 2021, by country
- Average social media usage time per weekday Japan FY 2021, by age
- Social media user penetration South Korea 2021, by age group
- Social media usage among SEC investment advisors 2017-2021, by social media
- Social media usage time Australia 2021 by age
Further Content: You might find this interesting as well
DataReportal. (February 3, 2022). Average time spent using social media by online consumers in the Asia-Pacific region from third quarter of 2019 to third quarter of 2021 (in hours and minutes) [Graph]. In Statista. Retrieved March 30, 2023, from https://www.statista.com/statistics/1293415/apac-time-spent-online-by-consumers-on-social-media/
DataReportal. "Average time spent using social media by online consumers in the Asia-Pacific region from third quarter of 2019 to third quarter of 2021 (in hours and minutes)." Chart. February 3, 2022. Statista. Accessed March 30, 2023. https://www.statista.com/statistics/1293415/apac-time-spent-online-by-consumers-on-social-media/
DataReportal. (2022). Average time spent using social media by online consumers in the Asia-Pacific region from third quarter of 2019 to third quarter of 2021 (in hours and minutes). Statista. Statista Inc.. Accessed: March 30, 2023. https://www.statista.com/statistics/1293415/apac-time-spent-online-by-consumers-on-social-media/
DataReportal. "Average Time Spent Using Social Media by Online Consumers in The Asia-pacific Region from Third Quarter of 2019 to Third Quarter of 2021 (in Hours and Minutes)." Statista, Statista Inc., 3 Feb 2022, https://www.statista.com/statistics/1293415/apac-time-spent-online-by-consumers-on-social-media/
DataReportal, Average time spent using social media by online consumers in the Asia-Pacific region from third quarter of 2019 to third quarter of 2021 (in hours and minutes) Statista, https://www.statista.com/statistics/1293415/apac-time-spent-online-by-consumers-on-social-media/ (last visited March 30, 2023)
Average time spent using social media by online consumers in the Asia-Pacific region from third quarter of 2019 to third quarter of 2021 (in hours and minutes) [Graph], DataReportal, February 3, 2022. [Online]. Available: https://www.statista.com/statistics/1293415/apac-time-spent-online-by-consumers-on-social-media/