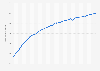
In the fourth quarter of 2023, Facebook's revenue in the Asia-Pacific region amounted to just over 7.5 billion U.S. dollars. This marked a significant increase from approximately six billion dollars in the last quarter of 2022.
Revenue of Facebook in the Asia-Pacific region from 1st quarter 2015 to 4th quarter 2023, by segment
(in million U.S. dollars)
Profit from the additional features of your individual account
Currently, you are using a shared account. To use individual functions (e.g., mark statistics as favourites, set
statistic alerts) please log in with your personal account.
If you are an admin, please authenticate by logging in again.
Learn more about how Statista can support your business.
Meta Platforms. (February 2, 2024). Revenue of Facebook in the Asia-Pacific region from 1st quarter 2015 to 4th quarter 2023, by segment (in million U.S. dollars) [Graph]. In Statista. Retrieved October 06, 2024, from https://www.statista.com/statistics/223282/facebooks-revenue-in-asia-since-1st-quarter-2010-by-segment/
Meta Platforms. "Revenue of Facebook in the Asia-Pacific region from 1st quarter 2015 to 4th quarter 2023, by segment (in million U.S. dollars)." Chart. February 2, 2024. Statista. Accessed October 06, 2024. https://www.statista.com/statistics/223282/facebooks-revenue-in-asia-since-1st-quarter-2010-by-segment/
Meta Platforms. (2024). Revenue of Facebook in the Asia-Pacific region from 1st quarter 2015 to 4th quarter 2023, by segment (in million U.S. dollars). Statista. Statista Inc.. Accessed: October 06, 2024. https://www.statista.com/statistics/223282/facebooks-revenue-in-asia-since-1st-quarter-2010-by-segment/
Meta Platforms. "Revenue of Facebook in The Asia-pacific Region from 1st Quarter 2015 to 4th Quarter 2023, by Segment (in Million U.S. Dollars)." Statista, Statista Inc., 2 Feb 2024, https://www.statista.com/statistics/223282/facebooks-revenue-in-asia-since-1st-quarter-2010-by-segment/
Meta Platforms, Revenue of Facebook in the Asia-Pacific region from 1st quarter 2015 to 4th quarter 2023, by segment (in million U.S. dollars) Statista, https://www.statista.com/statistics/223282/facebooks-revenue-in-asia-since-1st-quarter-2010-by-segment/ (last visited October 06, 2024)
Revenue of Facebook in the Asia-Pacific region from 1st quarter 2015 to 4th quarter 2023, by segment (in million U.S. dollars) [Graph], Meta Platforms, February 2, 2024. [Online]. Available: https://www.statista.com/statistics/223282/facebooks-revenue-in-asia-since-1st-quarter-2010-by-segment/