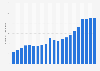
Microsoft's global brand value from 2006 to 2022 (in billion U.S. dollars)
Basic Account
Get to know the platform
You only have access to basic statistics.
This statistic is not included in your account.
Starter Account
The ideal entry-level account for individual users
- Instant access to 1m statistics
- Download in XLS, PDF & PNG format
- Detailed references
$59 USD $39 USD / Month *
in the first 12 months
Professional Account
Full access
Corporate solution including all features.
* Prices do not include sales tax.
Statistics on Microsoft
Overview
7
- Premium Statistic Global IT spending forecast 2012-2023, by segment
- Premium Statistic Software market revenue worldwide 2016-2027, by segment
- Premium Statistic Global public IT cloud services revenue 2016-2021, by segment
- Premium Statistic Global personal computing device shipment share by type 2020-2024
- Basic Statistic Biggest companies in the world by market value 2022
- Basic Statistic Most valuable technology brands worldwide in 2021
- Basic Statistic Apple, Google, and Microsoft: revenue comparison 2008-2021
Company financials
8
- Premium Statistic Microsoft: brand value 2006-2022
- Basic Statistic Microsoft's global revenue 2002-2022
- Basic Statistic Microsoft's revenue 2008-2023, by fiscal quarter
- Basic Statistic Net income of Microsoft 2002-2022
- Premium Statistic Microsoft's net income 2008-2023, by fiscal quarter
- Premium Statistic Microsoft's expenditure on research and development 2002-2022
- Premium Statistic Microsoft's yearly sales and marketing spending 2000-2022
- Premium Statistic Number of Microsoft employees 2005-2022
Segments
8
- Premium Statistic Revenue of Microsoft broken down by segment 2012-2022
- Premium Statistic Microsoft's productivity and business processes revenue worldwide FY 2015-2023
- Premium Statistic Microsoft's productivity and business processes income worldwide FY 2015-2023
- Premium Statistic Microsoft's intelligent cloud revenue worldwide 2015-2023, by quarter
- Premium Statistic Microsoft's intelligent cloud operating income worldwide 2015-2023, by quarter
- Premium Statistic Microsoft's 'More Personal Computing' segment revenue worldwide FY 2015-2023
- Premium Statistic Microsoft's 'More Personal Computing' segment operating income worldwide FY 2015-2023
- Premium Statistic External revenue of Microsoft broken down by major products and services 2016-2022
Competitors: Software
8
- Premium Statistic Top pure-play software and programming companies globally 2017-2022, by sales
- Premium Statistic Revenue and total expenses of major software companies 2020
- Premium Statistic Revenue per employee of major software companies worldwide 2020
- Premium Statistic Total assets and liabilities of major software companies 2020
- Premium Statistic Number of employees at major software companies 2020
- Premium Statistic Operating systems market share of desktop PCs 2013-2022, by month
- Premium Statistic Tablet OS market share worldwide 2016-2022, by quarter
- Premium Statistic Office productivity software market share worldwide 2022
Competitors: Cloud
7
- Premium Statistic Global top-10 cloud vendors by total revenue 2022
- Premium Statistic Global IaaS and PaaS hyperscaler revenue 2018-2021, by vendor
- Premium Statistic Cloud infrastructure services market share quarterly worldwide 2017-2022, by vendor
- Premium Statistic Market share of public cloud SaaS vendors worldwide 2019 and 2020
- Premium Statistic Public cloud platform usage and adoption worldwide 2022, by service provider
- Premium Statistic Private cloud platform service adoption worldwide 2022, by service provider
- Premium Statistic Global hybrid cloud provider number of official partners 2021, by hybrid solution
Competitors: Devices
6
- Premium Statistic PC revenue share by vendor worldwide 2018 to 2021
- Premium Statistic Vendors' market share of global PC shipments 2018 to 2021
- Premium Statistic Personal computer installed base share worldwide 2018 to 2021, by vendor
- Premium Statistic Game revenues of global companies 2021
- Premium Statistic Lifetime global unit sales of video game consoles as of September 2021
- Premium Statistic Current-gen video game console unit sales worldwide 2017-2021
Further related statistics
19
- Apple: brand value 2006-2022
- AT&T: brand value 2008-2022
- IBM: brand value 2006-2022
- Google: brand value 2006-2022
- Visa: global brand value 2009-2022
- Leading technology brands in India 2018 by brand value
- Marlboro: brand value 2006-2022
- Brand value of DirecTV 2014-2016
- Brand value of WrestleMania 2014-2017
- Brand value of ESPN 2012-2017
- Top 10 strongest nation brand performers in tourism segment 2014
- Brand value of BT 2014-2021
- Most valuable Asia-Pacific retail brands 2014
- Value share of the leading Chinese brands 2018, by category
- File types for Microsoft OneDrive in the U.S. 2018
- Annual IT consulting merger and acquisition deals made by Microsoft 2011-2015
- Operating income of football clubs in 2022
- Drivers for Microsoft OneDrive usage in the U.S. 2018
- Brand value of Viettel Group 2016-2021
Further Content: You might find this interesting as well
Statistics
- Apple: brand value 2006-2022
- AT&T: brand value 2008-2022
- IBM: brand value 2006-2022
- Google: brand value 2006-2022
- Visa: global brand value 2009-2022
- Leading technology brands in India 2018 by brand value
- Marlboro: brand value 2006-2022
- Brand value of DirecTV 2014-2016
- Brand value of WrestleMania 2014-2017
- Brand value of ESPN 2012-2017
- Top 10 strongest nation brand performers in tourism segment 2014
- Brand value of BT 2014-2021
- Most valuable Asia-Pacific retail brands 2014
- Value share of the leading Chinese brands 2018, by category
- File types for Microsoft OneDrive in the U.S. 2018
- Annual IT consulting merger and acquisition deals made by Microsoft 2011-2015
- Operating income of football clubs in 2022
- Drivers for Microsoft OneDrive usage in the U.S. 2018
- Brand value of Viettel Group 2016-2021
Kantar. (June 15, 2022). Microsoft's global brand value from 2006 to 2022 (in billion U.S. dollars) [Graph]. In Statista. Retrieved February 07, 2023, from https://www.statista.com/statistics/326058/microsoft-brand-value/
Kantar. "Microsoft's global brand value from 2006 to 2022 (in billion U.S. dollars)." Chart. June 15, 2022. Statista. Accessed February 07, 2023. https://www.statista.com/statistics/326058/microsoft-brand-value/
Kantar. (2022). Microsoft's global brand value from 2006 to 2022 (in billion U.S. dollars). Statista. Statista Inc.. Accessed: February 07, 2023. https://www.statista.com/statistics/326058/microsoft-brand-value/
Kantar. "Microsoft's Global Brand Value from 2006 to 2022 (in Billion U.S. Dollars)." Statista, Statista Inc., 15 Jun 2022, https://www.statista.com/statistics/326058/microsoft-brand-value/
Kantar, Microsoft's global brand value from 2006 to 2022 (in billion U.S. dollars) Statista, https://www.statista.com/statistics/326058/microsoft-brand-value/ (last visited February 07, 2023)
Microsoft's global brand value from 2006 to 2022 (in billion U.S. dollars) [Graph], Kantar, June 15, 2022. [Online]. Available: https://www.statista.com/statistics/326058/microsoft-brand-value/