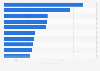
This statistic shows the online video consumption rate in Slovenia in 2016. During the survey period, it was found that 29 percent of Slovenian internet users watched online videos weekly.
How often do you watch online videos?
Basic Account
Get to know the platform
You only have access to basic statistics.
This statistic is not included in your account.
Starter Account
The ideal entry-level account for individual users
- Instant access to 1m statistics
- Download in XLS, PDF & PNG format
- Detailed references
$229 USD $199 USD / Month *
in the first 12 months
Professional Account
Full access
Business Solutions including all features.
* Prices do not include sales tax.
Other statistics that may interest you Statistics on
About the industry
10
- Premium Statistic Germany: online video consumption via smartphone 2017
- Premium Statistic Malaysia: online video consumption rate 2016
- Premium Statistic Canada: online video consumption rate 2016
- Premium Statistic Singapore: online video consumption rate 2016
- Premium Statistic Argentina: online video consumption rate 2016
- Premium Statistic Taiwan: online video consumption rate 2016
- Premium Statistic Mexico: online video consumption rate 2016
- Premium Statistic Turkey: online video consumption rate 2016
- Premium Statistic Brazil: online video consumption rate 2016
- Premium Statistic Vietnam: online video consumption rate 2016
About the region
10
- Premium Statistic Slovenia: online video consumption via computer 2016
- Premium Statistic Slovenia: internet connection used for online videos 2014
- Premium Statistic Slovenia: preferred online video consumption location at home 2014
- Premium Statistic Slovenia: group online video viewing 2014
- Premium Statistic Slovenia: most watched online video genres 2014
- Premium Statistic Slovenia: motivations for watching online videos 2015
- Premium Statistic Slovenia: online video sources 2015
- Premium Statistic Slovenia: mobile internet user penetration 2019-2028
- Premium Statistic Slovenia: mobile internet users 2019-2028
- Premium Statistic Slovenia: daily internet usage 2016, by age group
Selected statistics
1
Other regions
10
- Premium Statistic Australia: online video consumption rate 2016
- Premium Statistic Israel: online video consumption via computer 2016
- Premium Statistic Croatia: online video consumption via computer 2016
- Premium Statistic Serbia: online video consumption via smartphone 2016
- Premium Statistic Canada: online video consumption via computer 2016
- Premium Statistic Denmark: online video consumption via smartphone 2016
- Premium Statistic France: online video consumption via computer 2016
- Premium Statistic Germany: online video consumption via computer 2016
- Premium Statistic Greece: online video consumption via smartphone 2016
- Premium Statistic Hungary: online video consumption via computer 2016
Related statistics
10
- Premium Statistic Japan: online video consumption rate 2016
- Premium Statistic South Korea: online video consumption rate 2016
- Premium Statistic United States: online video consumption rate 2016
- Premium Statistic China: online video consumption rate 2016
- Premium Statistic Hong Kong: online video consumption rate 2016
- Premium Statistic Brazil: online video consumption via smartphone 2016
- Premium Statistic Mexico: online video consumption via computer 2016
- Premium Statistic Italy: online video consumption via smartphone 2016
- Premium Statistic United States: online video consumption via smartphone 2016
- Premium Statistic Hong Kong: online video consumption via computer 2016
Further related statistics
10
- Netflix's annual revenue 2002-2022
- Social network profile creation in the UK 2010-2020, by socio-economic group
- Households with internet access in GB from 2014 to 2020, by household composition
- User numbers of microblogs in China 2010-2018
- Daily internet use penetration in Great Britain 2006-2020
- Consumer electronics: Online purchasing in Great Britain 2020, by demographic
- E-mail messaging penetration in Great Britain 2007-2020
- Hours of internet use per week in the United Kingdom (UK) 2005-2019, by location
- Mobile internet use via laptops in Great Britain 2019, by demographic
- Internet usage on a mobile phone in Great Britain 2010-2019, by age
Further Content: You might find this interesting as well
Statistics
- Netflix's annual revenue 2002-2022
- Social network profile creation in the UK 2010-2020, by socio-economic group
- Households with internet access in GB from 2014 to 2020, by household composition
- User numbers of microblogs in China 2010-2018
- Daily internet use penetration in Great Britain 2006-2020
- Consumer electronics: Online purchasing in Great Britain 2020, by demographic
- E-mail messaging penetration in Great Britain 2007-2020
- Hours of internet use per week in the United Kingdom (UK) 2005-2019, by location
- Mobile internet use via laptops in Great Britain 2019, by demographic
- Internet usage on a mobile phone in Great Britain 2010-2019, by age
Google. (June 10, 2016). How often do you watch online videos? [Graph]. In Statista. Retrieved October 04, 2023, from https://www.statista.com/statistics/377049/online-video-consumption-rate-slovenia/
Google. "How often do you watch online videos?." Chart. June 10, 2016. Statista. Accessed October 04, 2023. https://www.statista.com/statistics/377049/online-video-consumption-rate-slovenia/
Google. (2016). How often do you watch online videos?. Statista. Statista Inc.. Accessed: October 04, 2023. https://www.statista.com/statistics/377049/online-video-consumption-rate-slovenia/
Google. "How Often Do You Watch Online Videos?." Statista, Statista Inc., 10 Jun 2016, https://www.statista.com/statistics/377049/online-video-consumption-rate-slovenia/
Google, How often do you watch online videos? Statista, https://www.statista.com/statistics/377049/online-video-consumption-rate-slovenia/ (last visited October 04, 2023)
How often do you watch online videos? [Graph], Google, June 10, 2016. [Online]. Available: https://www.statista.com/statistics/377049/online-video-consumption-rate-slovenia/