
- Media & Advertising›
- Radio, TV & Film›
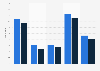
Share of Canadians watching video from selected sources 2015, by age
Industry-specific and extensively researched technical data (partially from exclusive partnerships).
A paid subscription is required for full access.
Percentage of consumers in Canada who viewed video content from selected sources as of March 2015, by age group
Exclusive Premium Statistic

TV only | Online only | Both TV and online | |
---|---|---|---|
- | - | - | - |
- | - | - | - |
- | - | - | - |
TV only | Online only | Both TV and online | |
---|---|---|---|
- | - | - | - |
- | - | - | - |
- | - | - | - |
You need a Premium Account for unlimited access.
Full access to 1.5m statistics
Incl. source references
Available to download in PNG, PDF, XLS format
You need a Premium Account for unlimited access.
Full access to 1.5m statistics
Incl. source references
Available to download in PNG, PDF, XLS format
© Statista 2019
About this statistic
Show source
Please be patient - this may take a moment
Description
Source
More information
- Show sources information
- Show publisher information
- Release date
- August 2015
- Region
- Canada
- Survey time period
- February and March 2015
- Number of respondents
- 7,016 respondents
- Method of interview
- Online survey
- Supplementary notes
- The source does not provide information on the exact age of respondents in each of the groups.
- Region
- Canada
- Survey time period
- February and March 2015
- Number of respondents
- 7,016 respondents
- Method of interview
- Online survey
- Supplementary notes
- The source does not provide information on the exact age of respondents in each of the groups.


You only have access to basic statistics.
This statistic is not included in your account!
- Instant access to 1m statistics
- Download in XLS, PDF & PNG format
- Detailed references
$49 / Month *
Corporate solution including all features.
Prices do not include sales tax.


Statista has been my savior on several occasions. The site is easy to maneuver and the data is in a format that can go right into a report or presentation.Marlene Greenfield
Vice President, Hearst Magazines
- Market overview
- Total consumer expenditure on physical and digital video in the Netherlands from 2009 to 2017 (in million euros)Total spending on physical and digital video in the Netherlands 2009-2017
- Total consumer expenditure on transactional Video on Demand in the Netherlands from 2009 to 2017 (in million euros)Total spending on TVOD in the Netherlands 2009-2017
- Online video advertising expenditure in the Netherlands from 1st half of 2015 to 2nd half of 2017 (in million euros)*Online video advertising spending quarterly in the Netherlands 2015-2017
- Number of video on-demand (VoD) services in the Netherlands as of December 2017, by genre Video on-demand services in the Netherlands 2017, by genre
- Distribution of the total video on demand (VoD) viewing time in the Netherlands in 2017, by channelDistribution of the video on demand viewing time in the Netherlands 2017, by channel
- Which sites or online services are you paying for?*Leading websites individuals are paying for in the Netherlands 2015
- Video usage
- Types of sites used to watch online video in the Netherlands in 2015Netherlands: online video sources 2015
- Share of respondents who sometimes use video sites and apps to watch videos in the Netherlands in 2017 and 2018, by platformsRanking of video platforms and apps in the Netherlands 2017-2018, by platforms
- Most common motivations for watching online videos in the Netherlands in 2015Netherlands: motivations for watching online videos 2015
- Time spent watching television or video in the Netherlands 2015, by age (in minutes per day)*Time spent watching television or video in the Netherlands 2015, by age
- Time spent watching television or video* in the Netherlands 2015, by gender (in minutes per day)Time spent watching tv or video in the Netherlands 2015, by gender
- Distribution of watching activity in the Netherlands in 2015, by age and categoryWatching activity in the Netherlands in 2015, by age and category
- Distribution of watching activity in the Netherlands in 2015, by gender and categoryWatching activity in the Netherlands in 2015, by gender and category
- YouTube
- Leading YouTube video producers from the Netherlands based on the number of subscribers as of April 2018 (in 1,000s)Leading Youtubers from the Netherlands based on subscribers 2018
- Leading YouTube video producers from the Netherlands based on total number of views as of April 2018 (in millions)Leading Youtubers from the Netherlands based on views 2018
- Number of subscriptions of selected Dutch speaking YouTube channels in the Netherlands in 2017, by Youtube channel (in 1,000s)Leading YouTube channels based on subscribers in the Netherlands 2017
- Share of respondents using Youtube in the Netherlands in 2016, by usage frequency*Usage frequency of Youtube in the Netherlands 2016
- Share of respondents using YouTube in the Netherlands in 2017 and 2018, by deviceDevices used to watch YouTube in the Netherlands 2017-2018
- Share of individuals using YouTube in the Netherlands in 2016, by provinceYouTube penetration in the Netherlands 2016, by province
- Netflix
- Quarterly number of Netflix subscribers in the Netherlands from the 1st quarter to the 4th quarter of 2016 (in 1,000s)Number of Netflix subscribers in the Netherlands 2016
- Quarterly share of households with a Netflix subscription in the Netherlands from the 1st quarter to the 4th quarter of 2016Share of households with a Netflix subscription in the Netherlands 2016
- Number of Netflix paying streaming subscribers in the Netherlands from 2013 to 2020 (in 1,000s)Netherlands: number of Netflix subscribers 2013-2020
- Monthly reach of on demand platforms Spotify and Netflix in the Netherlands from 2014 to 2018Reach of Spotify and Netflix in the Netherlands 2014-2018
- Share of respondents using Netflix in the Netherlands in 2016, by usage frequency*Usage frequency of Netflix in the Netherlands 2016
- Share of respondents using Netflix in the Netherlands in 2017 and 2018, by deviceDevices used to watch Netflix in the Netherlands 2017-2018
- Average time spent watching Netflix in the Netherlands in 2017, by age groupAverage time spent watching Netflix in the Netherlands 2017, by age group
- Other video services
- Share of respondents using VOD service NPO Uitzending Gemist in the Netherlands in 2016, by usage frequency*Usage frequency of VOD service NPO Uitzending Gemist in the Netherlands 2016
- Share of respondents using VOD service RTL XL in the Netherlands in 2016, by usage frequency*Usage frequency of VOD service RTL XL in the Netherlands 2016
- Share of respondents using VOD services of Ziggo in the Netherlands in 2016, by usage frequency*Usage frequency of VOD services of Ziggo in the Netherlands 2016
- Share of respondents using VOD service NPO Start in the Netherlands in 2017 and 2018, by deviceDevices used to watch VOD service NPO Start in the Netherlands 2017-2018
- Share of respondents using VOD service RTL XL in the Netherlands in 2017 and 2018, by deviceDevices used to watch VOD service RTL XL in the Netherlands 2017-2018
- Share of respondents using VOD services of Ziggo GO in the Netherlands in 2017 and 2018, by deviceDevices used to watch VOD services of Ziggo in the Netherlands 2017-2018
- Share of Canadians watching video from selected sources 2013-2015
- Share of Canadians watching video from selected sources 2015, by language
- Online video consumption on selected screens in Canada 2015, by length
- Ways to watch video content according to consumers in the U.S. 2014, by age
- Video content consumption reach in the U.S. 2014, by source
- YouTubers influence on young consumer brand choice in the U.S. 2014, by age
- Time spent watching video content on selected sources Kenya 2018
- Daily time spent with video by U.S. adults 2015-2019, by device
- Time spent watching video content in the U.S. 2017, by age
- Types of video content watched on Facebook and YouTube 2016
- Video consumption among Trailing Millennials in the U.S. 2016, by platform
- Daily time spent viewing TV/video content among internet users worldwide 2016
- Devices used for video content consumption in Canada 2014
- Canada time spent watching video 2015, by age
- Reasons for U.S. consumer to chose digital video content 2014
- Video consumption among Silent Generation in the U.S. 2016, by platform
- Online video content types watched by Canadians 2014
- Video on demand in Italy
- Video on demand in the Netherlands
- TV is Social - Episode 4
- Left to Your Own Devices - Q1 2018
- Committed
- The State of Online Video 2018
- Online TV in the U.S.
- Video on demand in Europe
- Pay TV in the United Kingdom (UK)
- Left to Your Own Devices - Q2 2017
- Video Content Consumption 2013
- The State of Online Video 2017
- Netflix
- Subscription video on demand market in the U.S.
- Netflix in Europe
- Time spent watching television or video* in the Netherlands 2015, by gender (in minutes per day)
- Types of video content watched on Facebook and YouTube among internet users in the United States as of March 2016
- Average daily time spent viewing TV/video content by internet users worldwide as of 2nd quarter 2016, by country (in hours)
- Time spent watching video content among consumers in Canada in 2015, by age group (in hours)
- Total consumer expenditure on physical and digital video in the Netherlands from 2009 to 2017 (in million euros)
- Total consumer expenditure on transactional Video on Demand in the Netherlands from 2009 to 2017 (in million euros)
- Online video advertising expenditure in the Netherlands from 1st half of 2015 to 2nd half of 2017 (in million euros)*
- Number of video on-demand (VoD) services in the Netherlands as of December 2017, by genre
- Distribution of the total video on demand (VoD) viewing time in the Netherlands in 2017, by channel
- Which sites or online services are you paying for?*
- Types of sites used to watch online video in the Netherlands in 2015
- Share of respondents who sometimes use video sites and apps to watch videos in the Netherlands in 2017 and 2018, by platforms
- Most common motivations for watching online videos in the Netherlands in 2015
- Time spent watching television or video in the Netherlands 2015, by age (in minutes per day)*
- Distribution of watching activity in the Netherlands in 2015, by age and category
- Distribution of watching activity in the Netherlands in 2015, by gender and category
- Leading YouTube video producers from the Netherlands based on the number of subscribers as of April 2018 (in 1,000s)
- Leading YouTube video producers from the Netherlands based on total number of views as of April 2018 (in millions)
- Number of subscriptions of selected Dutch speaking YouTube channels in the Netherlands in 2017, by Youtube channel (in 1,000s)
- Share of respondents using Youtube in the Netherlands in 2016, by usage frequency*
- Share of respondents using YouTube in the Netherlands in 2017 and 2018, by device
- Share of individuals using YouTube in the Netherlands in 2016, by province
- Quarterly number of Netflix subscribers in the Netherlands from the 1st quarter to the 4th quarter of 2016 (in 1,000s)
- Quarterly share of households with a Netflix subscription in the Netherlands from the 1st quarter to the 4th quarter of 2016
- Number of Netflix paying streaming subscribers in the Netherlands from 2013 to 2020 (in 1,000s)
- Monthly reach of on demand platforms Spotify and Netflix in the Netherlands from 2014 to 2018
- Share of respondents using Netflix in the Netherlands in 2016, by usage frequency*
- Share of respondents using Netflix in the Netherlands in 2017 and 2018, by device
- Average time spent watching Netflix in the Netherlands in 2017, by age group
- Share of respondents using VOD service NPO Uitzending Gemist in the Netherlands in 2016, by usage frequency*
- Share of respondents using VOD service RTL XL in the Netherlands in 2016, by usage frequency*
- Share of respondents using VOD services of Ziggo in the Netherlands in 2016, by usage frequency*
- Share of respondents using VOD service NPO Start in the Netherlands in 2017 and 2018, by device
- Share of respondents using VOD service RTL XL in the Netherlands in 2017 and 2018, by device
- Share of respondents using VOD services of Ziggo GO in the Netherlands in 2017 and 2018, by device
- Percentage of consumers in Canada who viewed video content from selected sources in 2013 and 2015
- Percentage of consumers in Canada who viewed video content from selected sources as of March 2015, by language
- Online video content viewing on selected devices in Canada as of March 2015, by length
- In which of the following ways do you watch video in a typical month?
- Penetration of video content consumption among young consumers in the United States in 2014, by source
- Influence of product or brand recommendations by YouTubers on young consumers in the United States in 2014, by age group
- Share of time spent consuming video content via selected sources in Kenya in 2018
- Daily time spent with video content among adults in the United States from 2015 to 2019, by device (in minutes)
- Weekly time spent watching video content in the United States as of November 2017, by age group (in hours)
- Weekly time spent with video content among Trailing Millennials in the United States from 1st quarter 2016 to 4th quarter 2016, by platform (in minutes)
- Percentage of consumers in Canada using selected devices to watch video content as of October 2014
- Leading reasons for choosing digital video content according to consumers in the United States in 2014
- Weekly time spent with video content among Silent Generation in the United States from 1st quarter 2016 to 4th quarter 2016, by platform (in minutes)
- Types of video content viewed online by consumers in Canada as of October 2014
Statista offers dossiers and reports on over 170 industries. With Statista you are always able to make informed decisions and boost your work efficiency.
Internet & Telecommunications
- Social Media
- E-Commerce
- Online Video & Entertainment
- Advertising & Marketing
Consumer Goods & FMCG
- Alcoholic Beverages
- Cleaning Products
- Cosmetics & Personal Care
- Food & Nutrition
Retail & Trade
- Health & Hygiene
- International Trade
- Shopping Behavior
- Sports & Leisure
Travel, Tourism & Hospitality
- Business Travel
- Leisure Travel
- Accomodation
- Restaurants
Society
- Demographics
- Economy
- Education & Science
- Politics & Government
Transportation & Logistics
- Aviation
- Rail Transport
- Vehicles & Road Traffic
- Water Transport
You can only download this statistic as a Premium user.
As a Premium user you get access to the detailed source references and background information about this statistic.
As a Premium user you get access to background information and details about the release of this statistic.
As soon as this statistic is updated, you will immediately be notified via e-mail.
You need at least a Premium Account to use this feature.
This feature is limited to our corporate solutions.
Please contact us to get started with full access to dossiers, forecasts, studies and international data.

The Italian pharmaceutical market is among the fastest growing ones worldwide. This dossier provides data on the trends of the market, with special focus on pharmaceutical segments.

To our 150 Reports we added:
- Global Consumer Survey content
- Operational risk index by Fitch
- And more …

The global plastics industry is growing by approximately three percent every year. This dossier provides information about the global plastics industry in general as well as chapters on the major types of plastic, and recycling rates.

Updates on eCommerce, Digital Media, eTravel, eServices and more
- Market figures for 2018 to 2023
- Company and startup profiles
- User demographics

U.S. coal production has steadily declined in the past decade, but has been in the news in recent years due to President Trump's desire to revitalize the industry. This document provides an overview of the key figures, leading companies, and the employment trends in the U.S. coal mining industry.

This new export feature offers
- Structured graphical representation of the data
- Tailored target group analysis
- Option for further processing

The Polish e-commerce market is one of the fastest developing e-commerce markets in Europe. The latest data for Poland is presented in this dossier.

Plastic waste is an issue of global concern. Since China banned the import of recycled plastic, the U.S. has had to make adjustments to its management of plastic waste. This dossier provides an overview of plastic waste in the U.S.

This dossier provides an overview of hedge funds worldwide. Global hedge fund assets, performance, investors, and other topics are highlighted.

The Outdoor Advertising Association of America covers amongst others
- Number of billboards
- Outdoor advertising revenue
- Number of out-of-home displays

Find data, perceptions & more about
- Economic consequences
- Impact on the labor market
- A second referendum

Understand the recent developments in the Spanish eCommerce market!
- URL-related revenues
- Relevant online store KPIs
- eCommerce-related contacts

- Extended statistical dossier
- Insights, explanations & interpretations
- Challenges of the digital future

eCommerce is rapidly becoming a part of the Latin American shopping culture. The dossier includes data on
- Regional online shopping events
- Events by country

The outline of potential impacts of Brexit on UK industries has been updated in the UK Industry Reports.

Italian enterprises invest significantly in digital marketing. Find out about
- Relevant aspects & KPIs
- New trends
- Different strategies

Statista European Football Benchmark
- The big 5 European leagues
- All about the clubs & fans
- Sponsors & how they fit in
We use cookies to personalize contents and ads, offer social media features, and analyze access to our website. In your browser settings you can configure or disable this, respectively, and can delete any already placed cookies. For details, please see your browser’s Help section (by pressing F1). Please see our privacy statement for details about how we use data.