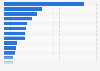
- Media & Advertising›
- Music›
Spotify's employees 2017, by region
Industry-specific and extensively researched technical data (partially from exclusive partnerships).
A paid subscription is required for full access.
Number of Spotify employees worldwide in 2017, by region
Exclusive Premium Statistic

Number of employees | |
---|---|
- | - |
- | - |
- | - |
Number of employees | |
---|---|
- | - |
- | - |
- | - |
You need a Premium Account for unlimited access.
Full access to 1.5m statistics
Incl. source references
Available to download in PNG, PDF, XLS format
You need a Premium Account for unlimited access.
Full access to 1.5m statistics
Incl. source references
Available to download in PNG, PDF, XLS format
© Statista 2019
About this statistic
Show source
Please be patient - this may take a moment
Description
Source
More information
- Show sources information
- Show publisher information
- Release date
- February 2018
- Region
- Worldwide
- Survey time period
- 2017
- Supplementary notes
- The source adds the following information: "Additionally, at the end of 2017 we had approximately 308 employees, respectively, in the aggregate in Australia, Belgium, Brazil, Canada, Denmark, Finland, France, Germany, Hong Kong, India, Italy, Japan, Mexico, Netherlands, Norway, Poland, Russia, Singapore, Spain, Taiwan, and Turkey on average."


You only have access to basic statistics.
This statistic is not included in your account!
- Instant access to 1m statistics
- Download in XLS, PDF & PNG format
- Detailed references
$49 / Month *
Corporate solution including all features.
Prices do not include sales tax.


Statista has been my savior on several occasions. The site is easy to maneuver and the data is in a format that can go right into a report or presentation.Marlene Greenfield
Vice President, Hearst Magazines
- Market overview
- Total revenue of music streaming services in the Netherlands from 2012 to 2017 (in million euros)Revenue of music streaming in the Netherlands 2012-2017
- Share of music streaming services in the total revenue of the music industry in Netherlands from 2013 to 2017Revenue share of music streaming in the Netherlands 2013-2017
- Distribution of music industry revenue in the Netherlands in 2017, by categoryDistribution of music industry revenue in the Netherlands 2017, by category
- Do you use the free or paid version of online music services?*Free and paid online music services usage in the Netherlands in 2017
- Which digital media subscription services do you use?*Online media subscription services usage in the Netherlands 2016
- Annual revenue of the digital music industry in the Netherlands from 2012 to 2017, with a forecast for 2018 to 2022 (in million euros)Digital music industry revenue in the Netherlands 2012-2022
- Spotify
- Total number of users of Spotify, Apple Music and Deezer in the Netherlands as of 1st quarter of 2018 (in 1,000s)Number of Spotify, Apple Music and Deezer users in the Netherlands 2018
- Share of respondents who have a Spotify subscription in the Netherlands in 2015 and 2017Spotify subscription share in the Netherlands 2015-2017
- Leading music app titles in the Apple App Store in the Netherlands in October 2018, by number of downloads (in 1,000s)Leading iPhone music apps in the Netherlands 2018, by downloads
- Leading music app titles in the Apple App Store in the Netherlands in October 2018, by revenue (in 1,000 U.S. dollars)Leading iPhone music apps in the Netherlands 2018, by revenue
- Monthly reach of on demand platforms Spotify and Netflix in the Netherlands from 2014 to 2018Reach of Spotify and Netflix in the Netherlands 2014-2018
- Other streaming services
- Which online music services do you use?*Usage of online music services in the Netherlands in 2017
- Share of respondents who have a Google Play subscription in the Netherlands in 2015 and 2017Google Play subscription share in the Netherlands 2015-2017
- Share of respondents who have a Deezer subscription in the Netherlands in 2015 and 2017Deezer subscription share in the Netherlands 2015-2017
- Average daily reach of YouTube as a music service amongst Millennials and average consumers in the Netherlands in 2017Daily reach YouTube for music Millennials and average consumers in Netherlands 2017
- Most popular media apps on tablets in the Netherlands in 2017 and 2018, based on install baseMost popular media apps on tablets in the Netherlands 2017-2018
- Share of respondents using YouTube in the Netherlands in 2017 and 2018, by age groupYouTube penetration rate in the Netherlands 2017-2018, by age group
- Overall user demographics
- Do you use the free or paid version of online music services?*Free and paid online music services usage in the Netherlands in 2017
- Market share of music sources used by Millennials in the Netherlands in 2017Leading music sources of Millennials in the Netherlands 2017
- Monthly reach of Apple Music and Spotify in the Netherlands in January 2017, by age groupMonthly reach of Apple Music and Spotify in the Netherlands 2017, by age group
- Distribution of individuals listening to radio, online music services or own music in the Netherlands 2017, by ageRadio and music consumption in the Netherlands in 2017, by audio type and age
- Distribution of individuals listening to radio, online music services or own music in the Netherlands 2017, by genderRadio and music consumption in the Netherlands in 2017, by audio type and gender
- Average daily reach of music services amongst Millennials and average consumers in the Netherlands in 2017Daily reach music services Millennials and average consumers in the Netherlands 2017
- Spotify's quarterly revenue 2016-2018
- Spotify artist royalty payments 2012-2015
- Spotify's premium subscribers in North America 2016-2017
- Time spent listening to Spotify content 2015-2017
- Spotify's sales and marketing costs 2013-2018
- Spotify's gross profit 2015-2017, by segment
- Spotify's premium subscribers in Latin America 2016-2017
- Spotify's gross profit 2013-2018
- Spotify's monthly active users in the rest of the world 2016-2017
- Spotify's monthly active users in Latin America 2016-2017
- Spotify revenue and net income 2009-2018
- Italy: preferred music platforms 2018
- Spotify usage frequency in the U.S. 2017, by gender
- Spotify usage frequency in the U.S. 2017, by age
- Spotify users according to access device in Spain 2015
- Spotify revenue per employee 2013-2014
- Spotify's revenue and net income in the United Kingdom (UK) 2009-2014
- Spotify's revenue in the United Kingdom (UK) 2012-2014, by category
- Spotify and music streaming in the Netherlands
- Spotify
- Spotify Form F-1 Registration Statement
- Music industry in the U.S.
- Digital music in Finland
- Digital music in the U.S.
- Music industry in the United Kingdom (UK)
- Pandora
- Digital music in the United Kingdom (UK)
- Sirius XM
- Music industry in Europe
- Digital music in the U.S. (DMO)
- Podcasting in the U.S.
- Digital entertainment and media in Canada
- Music industry in Finland
- Royalty and distribution costs of Spotify from 2012 to 2015 (in million euros)
- Spotify's revenue and net income/loss from 2009 to 2018 (in million euros)
- How often do you use Spotify?
- Spotify's revenue per employee from 2013 to 2014 (in 1,000 euros)
- Total revenue of music streaming services in the Netherlands from 2012 to 2017 (in million euros)
- Share of music streaming services in the total revenue of the music industry in Netherlands from 2013 to 2017
- Distribution of music industry revenue in the Netherlands in 2017, by category
- Do you use the free or paid version of online music services?*
- Which digital media subscription services do you use?*
- Annual revenue of the digital music industry in the Netherlands from 2012 to 2017, with a forecast for 2018 to 2022 (in million euros)
- Total number of users of Spotify, Apple Music and Deezer in the Netherlands as of 1st quarter of 2018 (in 1,000s)
- Share of respondents who have a Spotify subscription in the Netherlands in 2015 and 2017
- Leading music app titles in the Apple App Store in the Netherlands in October 2018, by number of downloads (in 1,000s)
- Leading music app titles in the Apple App Store in the Netherlands in October 2018, by revenue (in 1,000 U.S. dollars)
- Monthly reach of on demand platforms Spotify and Netflix in the Netherlands from 2014 to 2018
- Which online music services do you use?*
- Share of respondents who have a Google Play subscription in the Netherlands in 2015 and 2017
- Share of respondents who have a Deezer subscription in the Netherlands in 2015 and 2017
- Average daily reach of YouTube as a music service amongst Millennials and average consumers in the Netherlands in 2017
- Most popular media apps on tablets in the Netherlands in 2017 and 2018, based on install base
- Share of respondents using YouTube in the Netherlands in 2017 and 2018, by age group
- Market share of music sources used by Millennials in the Netherlands in 2017
- Monthly reach of Apple Music and Spotify in the Netherlands in January 2017, by age group
- Distribution of individuals listening to radio, online music services or own music in the Netherlands 2017, by age
- Distribution of individuals listening to radio, online music services or own music in the Netherlands 2017, by gender
- Average daily reach of music services amongst Millennials and average consumers in the Netherlands in 2017
- Revenue of Spotify worldwide from 1st quarter 2016 to 4th quarter 2018 (in million euros)
- Number of Spotify premium subscribers in North America from 1st quarter 2016 to 4th quarter 2017 (in millions)
- Cumulative time spent listening to Spotify content worldwide from 1st quarter 2015 to 4th quarter 2017 (in billion hours)
- Sales and marketing costs of Spotify worldwide from 2013 to 2018 (in million euros)
- Gross profit of Spotify worldwide from 2015 to 2017, by segment (in million euros)
- Number of Spotify premium subscribers in Latin America from 1st quarter 2016 to 4th quarter 2017 (in millions)
- Gross profit of Spotify worldwide from 2013 to 2018 (in million euros)
- Number of Spotify monthly active users in the rest of the world* from 1st quarter 2016 to 4th quarter 2017 (in millions)
- Number of Spotify monthly active users in Latin America from 1st quarter 2016 to 4th quarter 2017 (in millions)
- Preferred online platforms for music streaming in Italy in 2018, by platform
- Percentage of users of Spotify according to the type of device from which they accessed it, in Spain in 2015
- Spotify's revenue and net income in the United Kingdom (UK) from 2009 to 2014 (in million GBP)
- Spotify's revenue in the United Kingdom (UK) from 2012 to 2014, by category (in million GBP)
Statista offers dossiers and reports on over 170 industries. With Statista you are always able to make informed decisions and boost your work efficiency.
Internet & Telecommunications
- Social Media
- E-Commerce
- Online Video & Entertainment
- Advertising & Marketing
Consumer Goods & FMCG
- Alcoholic Beverages
- Cleaning Products
- Cosmetics & Personal Care
- Food & Nutrition
Retail & Trade
- Health & Hygiene
- International Trade
- Shopping Behavior
- Sports & Leisure
Travel, Tourism & Hospitality
- Business Travel
- Leisure Travel
- Accomodation
- Restaurants
Society
- Demographics
- Economy
- Education & Science
- Politics & Government
Transportation & Logistics
- Aviation
- Rail Transport
- Vehicles & Road Traffic
- Water Transport
You can only download this statistic as a Premium user.
As a Premium user you get access to the detailed source references and background information about this statistic.
As a Premium user you get access to background information and details about the release of this statistic.
As soon as this statistic is updated, you will immediately be notified via e-mail.
You need at least a Premium Account to use this feature.
This feature is limited to our corporate solutions.
Please contact us to get started with full access to dossiers, forecasts, studies and international data.

The global plastics industry is growing by approximately three percent every year. This dossier provides information about the global plastics industry in general as well as chapters on the major types of plastic, and recycling rates.

Updates on eCommerce, Digital Media, eTravel, eServices and more
- Market figures for 2018 to 2023
- Company and startup profiles
- User demographics

U.S. coal production has steadily declined in the past decade, but has been in the news in recent years due to President Trump's desire to revitalize the industry. This document provides an overview of the key figures, leading companies, and the employment trends in the U.S. coal mining industry.

This new export feature offers
- Structured graphical representation of the data
- Tailored target group analysis
- Option for further processing

The Polish e-commerce market is one of the fastest developing e-commerce markets in Europe. The latest data for Poland is presented in this dossier.

Plastic waste is an issue of global concern. Since China banned the import of recycled plastic, the U.S. has had to make adjustments to its management of plastic waste. This dossier provides an overview of plastic waste in the U.S.

This dossier provides an overview of hedge funds worldwide. Global hedge fund assets, performance, investors, and other topics are highlighted.

The Outdoor Advertising Association of America covers amongst others
- Number of billboards
- Outdoor advertising revenue
- Number of out-of-home displays

Find data, perceptions & more about
- Economic consequences
- Impact on the labor market
- A second referendum

Understand the recent developments in the Spanish eCommerce market!
- URL-related revenues
- Relevant online store KPIs
- eCommerce-related contacts

- Extended statistical dossier
- Insights, explanations & interpretations
- Challenges of the digital future

eCommerce is rapidly becoming a part of the Latin American shopping culture. The dossier includes data on
- Regional online shopping events
- Events by country

The outline of potential impacts of Brexit on UK industries has been updated in the UK Industry Reports.

Italian enterprises invest significantly in digital marketing. Find out about
- Relevant aspects & KPIs
- New trends
- Different strategies

Statista European Football Benchmark
- The big 5 European leagues
- All about the clubs & fans
- Sponsors & how they fit in

What are online shoppers' payment preferences around the world?
- Data on all payment methods
- Analysis for 50 countries
- Forecasts up to 2023
We use cookies to personalize contents and ads, offer social media features, and analyze access to our website. In your browser settings you can configure or disable this, respectively, and can delete any already placed cookies. For details, please see your browser’s Help section (by pressing F1). Please see our privacy statement for details about how we use data.