Skip to main content
Consumer Goods & FMCG
E-Commerce
Economy & Politics
Energy & Environment
Health, Pharma & Medtech
Internet
Media
Technology & Telecommunications
Transportation & Logistics
Travel, Tourism & Hospitality
View all industries
Global data volume growth
Global AI market size
Number of generative AI users worldwide
Global inflation rate
Retail e-commerce sales worldwide
Largest economies worldwide
Biggest social media platforms by users
Global EV market share by manufacturer
International tourist arrivals by world region
Global annual CO₂ emissions
Browse recent statistics
Artificial intelligence (AI) worldwide
TikTok
Nvidia
E-commerce worldwide
Global GDP
Instagram
Apparel market worldwide
Video gaming worldwide
Global renewable energy industry
Influencer marketing worldwide
Browse recent topics
Consumer Trends 2026
Artificial Intelligence: in-depth market analysis
E-commerce challenges
Global economy
TikTok
Luxury goods: in-depth market analysis
Electric vehicles: A global overview
Video gaming worldwide
Travel and tourism trends 2026
Battery recycling worldwide
Browse recent reports
Explore the tool
Explore Classic mode
Advertising & Media
eCommerce
Consumer
Finance
Global Indicators
Health
Industrial
Mobility
Technology
Explore Market Insights
eCommerce Insights
Research AI
Book a demo
All integrations
Developer docs
Explore Statista Connect
Research
Strategy & Consulting
Marketing
Media & PR
Explore AI assistants
Marketing
Research & Development
Strategy
Sales
Find the fact
Tell the story
Win the pitch
Understand the market
Develop your strategy
Academia
Agencies
Consultancies
Consumer goods
Finance
Tech
Research solutions
Strategy consulting
Communication services
Explore Statista+
Statista R
Statista Healthcare
About Statista
First steps & help center
Webinar & training hub
Success stories
Individuals & Small Teams
Businesses & Enterprises
Academia & Government
English
Deutsch
Daily Data
Global stories vividly visualized
State Population
Jul 17, 2018
Projected population of the most populous U.S. states in 2040 with Senate representation.
More Information
Sponsored Post
Jul 17, 2018
This chart shows some interesting facts about the future of furniture shopping.
More Information
Celebrity Earnings
Jul 17, 2018
This chart shows the top-10 highest-paid celebrities by annual earnings in 2018.
More Information
Wine Fraud
Jul 17, 2018
This chart shows the potential profit from fraudulently selling wine from Spain as 'French.'
More Information
China
Jul 17, 2018
The chart shows the Annual trade with China by curency as share of the respective country's GDP.
More Information
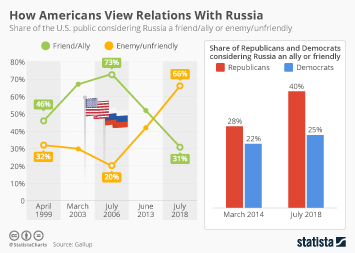
Trump & Russia
Jul 17, 2018
This chart shows the share of the U.S. public considering Russia a friend/ally or enemly/unfriendly.
More Information
Japan
Jul 17, 2018
This chart shows the most punctual mega airlines worldwide in 2017, based on percentage of punctual flights.
More Information
China
Jul 17, 2018
This chart shows the top 10 e-commerce retailers in China as of June 2018, by sales share.*
More Information
Family Size
Jul 16, 2018
Here is the story of a lovely chart on ideal family size from 1936 to 2018.
More Information
Vladimir Putin
Jul 16, 2018
This chart shows Vladimir Putin's approximate level of lateness to meetings (hours/minutes).
More Information
Helsinki Summit
Jul 16, 2018
This chart shows the share having no confidence in Trump/Putin doing the right thing regarding world affairs.
More Information
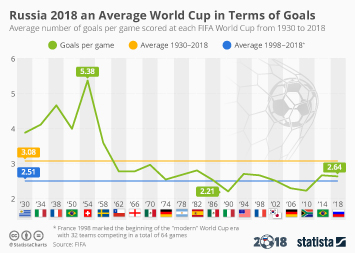
FIFA World Cup 2018
Jul 16, 2018
This chart shows how many goals were scored in an average game at each World Cup since 1930.
More Information
Afghanistan
Jul 16, 2018
This chart shows the number of civilians killed and injured in Afghanistan at mid-year point (January to June).
More Information
U.S./Russia Summit
Jul 16, 2018
This chart shows what the U.S. public thinks Trump should discuss with Putin in there July 16 meeting.
More Information
World Cup
Jul 16, 2018
This chart shows the Google Trends value for the search term "it's coming home" in England.
More Information
Data Security
Jul 16, 2018
This chart shows the average total cost of a data breach in selected countries in 2018.
More Information
Guinness World Records
Jul 13, 2018
This chart shows the length of Shridhar Chillal's fingernails in 2015.
More Information
Videogames
Jul 13, 2018
This chart shows the leading game content on Twitch worldwide by number of hours viewed.
More Information
Emmy Awards
Jul 13, 2018
This chart shows how many Emmy nominations slected major online services received in 2018.
More Information
Forbes List
Jul 13, 2018
This chart shows the age and net worth of Forbes' richest self-made women for 2018.
More Information
Brexit
Jul 13, 2018
This chart shows the share of UK-based CFOs who say the business environment will be better/worse after Brexit.
More Information
Jul 13, 2018
This chart shows the popularity of Theresa May and Boris Johnson in 2018.
More Information
Television
Jul 13, 2018
This chart shows the TV shows with the most Emmy 2018 nominations.
More Information
Trade
Jul 13, 2018
This chart shows responses to: "do you think this country has a fair or unfair trade policy with the U.S.?"
More Information
Digital News
Jul 13, 2018
The chart shows news publishers by subscriber numbers and cost of digital subscription.
More Information
International tariffs
Jul 12, 2018
This chart shows the impact of US tariffs on the Chinese economy.
More Information
Energy Imports
Jul 12, 2018
This chart shows German dependence on energy imports from 2006 to 2016.
More Information
Natural Gas
Jul 12, 2018
This chart shows the distribution of Russia's natural gas exports in 2016.
More Information
Health
Jul 12, 2018
This chart shows the number of people on the NHS waiting list from 2007 to 2018.
More Information
Uber
Jul 12, 2018
This chart shows the average earnings of U.S. male and female Uber drivers.
More Information
Renting
Jul 12, 2018
This chart shows the average monthly rent for a two-bedroom apartment in selected cities in 2018.
More Information
India
Jul 11, 2018
This chart shows the share of the ride hailing market in India as of December 2017, by company.
More Information
Australia
Jul 11, 2018
This chart shows the mean download speed of broadband internet around the world and Australia.
More Information
FIFA World Cup
Jul 11, 2018
This chart shows how many people watched the FIFA World Cup Final in 2010 and 2014.
More Information
Climate Change
Jul 11, 2018
More Information
U.S. Politics
Jul 11, 2018
This chart shows the percentage of votes coded as conservative in each justice's Supreme Court career, through the 2016 term.
More Information
China
Jul 11, 2018
This chart shows the leading topics addressing the US-China trade war on Chinese social media service Weibo.
More Information
European Union
Jul 10, 2018
This chart shows top-earning MEPs from private activities and second jobs (in €).
More Information
Japan
Jul 10, 2018
This chart shows the most popular Instagram accounts of Japanese brands as of July 2018*.
More Information
Turkey
Jul 10, 2018
This chart shows the number of employees fired by the Turkish government.
More Information
Politics
Jul 10, 2018
Survey responses on the subject of U.S. President Trump's 2018 visit to the United Kingdom*
More Information
Border Apprehensions
Jul 10, 2018
This chart shows apprehensions at the Southwest border from January to June.
More Information
UK Politics
Jul 10, 2018
This chart shows UK government resignations/dismissals since November 2017.
More Information
Sonos
Jul 9, 2018
This chart shows worldwide unit sales and household penetration of Sonos home audio products.
More Information
Subway Networks
Jul 9, 2018
This chart shows global metro/subway systems by number of stations (2015).
More Information
FIFA World Cup 2018
Jul 9, 2018
This chart shows the number of goals at the 2018 FIFA World Cup scored by players from the Europe's top 5 leagues.
More Information
World Cup
Jul 9, 2018
This chart shows the win probability of teams in the World Cup 2018 semi-final matches.
More Information
Brexit
Jul 9, 2018
This chart shows survey responses to the question: "You said that you believe Brexit is going badly. Whose fault do you believe this...
More Information
Russia
Jul 9, 2018
Deaths un the UK allegedly linked to the Russian government by US spy agencies.
More Information
App Stores
Jul 6, 2018
This chart shows the share of global app downloads and consumer spend by app store.
More Information
Media
Jul 6, 2018
The chart shows Britain's most trusted media sources.
More Information
Spain
Jul 6, 2018
This chart shows participants running with the bulls in the San Fermín festival in 2017.
More Information
Samsung
Jul 6, 2018
This chart shows Samsung's sales and year-over-year sales growth since Q1 2015.
More Information
World Cup
Jul 6, 2018
This chart shows the results of matches between England and Sweden and key facts for both teams.
More Information
Financial Inequality
Jul 6, 2018
This chart shows the share of wealth held by the richest 10% of households.
More Information
Immigration
Jul 6, 2018
This chart shows the U.S. states with the largest growth in citizenship application backlogs from FY17 Q1 to FY18 Q1.
More Information
World Cup
Jul 6, 2018
This chart shows projected retail spending during the 2018 World Cup in the UK, by product category.
More Information
Insects
Jul 5, 2018
This chart shows the expected growth of the edible insect market and number of edible species by country.
More Information
Netflix vs. TV
Jul 5, 2018
This chart shows the results of a survey about Americans' favorite TV platforms.
More Information
World Cup
Jul 5, 2018
This chart shows the win probability of teams in the World Cup 2018 quarter final matches.
More Information
London
Jul 5, 2018
This chart shows offences committed by suspects on a moped/motorcycle in London.
More Information
World Cup
Jul 4, 2018
This chart shows the results of FIFA World Cup penalty shootouts involving England.
More Information
Disney acquires parts of 21st Century Fox
Jul 4, 2018
This chart shows the domestic box office market share of the six largest film studios since 1995.
More Information
Independence Day
Jul 4, 2018
This chart shows food sales in the two weeks around Independence Day.
More Information
Greece
Jul 4, 2018
This chart shows real GDP growth in Greece from 1980 to 2018 (annual percentage change).
More Information
Japan
Jul 4, 2018
This chart shows the leading Japanese brands in 2018, by brand value.
More Information
Bike-Sharing
Jul 3, 2018
This chart shows the number of bike-sharing programs in operation worldwide.
More Information
Copa do Mundo 2018
Jul 3, 2018
Este infográfico mostra a diferença entre opinião pública e probabilidade de que as seguintes seleções vençam o mundial.
More Information
Doping
Jul 3, 2018
This chart shows Tour de France cyclists involved in doping cases from 1998 to 2017 ( % of participants)*
More Information
India
Jul 3, 2018
This chart shows the number of cyber crimes across India in 2017 by type of crime.
More Information
China's Trade Disputes
Jul 2, 2018
This chart shows the number of Chinese trade disputes with WTO members in 2018.
More Information
Trade Disputes
Jul 2, 2018
This chart shows the number of U.S. trade dispites with WTO members in 2018.
More Information
Unicorns
Jul 2, 2018
The chart shows Unicorn births in Asia per city (2012 - 2017).
More Information
Corruption
Jul 2, 2018
This chart shows the share of people who had paid a bribe to access basic services over the past year.
More Information
Union Membership
Jul 2, 2018
This chart shows private and public union membership in the U.S.
More Information
United Kingdom
Jun 29, 2018
This chart shows the share that say the clothes in certain UK-available outlets are too small for their stated size.
More Information
Voice Assistants
Jun 29, 2018
The chart shows the market share of voice assistants in the U.S.
More Information
United States Immigration
Jun 29, 2018
This chart shows the migration of Muslim refugees to the U.S. from 2000 to 2017.
More Information
Tech
Jun 29, 2018
This chart shows the computational performance of the UK's most powerful supercomputers as of June 2018.
More Information
U.S. Politics
Jun 29, 2018
This chart shows the responses of U.S. adults born in Latin America about the biggest challenges they face.
More Information
United Kingdom
Jun 29, 2018
This chart shows the share proud/embarrassed to identify as English in March 2018.
More Information
Refugees
Jun 29, 2018
This chart shows the number of asylum seekers and people entitled to protection (selected EU countries).
More Information
World Cup
Jun 29, 2018
This chart shows the results of matches between England and Colombia and key facts for both teams.
More Information
Health
Jun 29, 2018
This chart shows the share meeting federal aerobic and muscle strengthening guidelines.
More Information
Pollution
Jun 28, 2018
This chart shows trash cleaned up on beaches worldwide in a special 24-hour cleanup event.
More Information
Google Pay in Germany
Jun 28, 2018
This chart shows the countries where it's possible to use Google Pay.
More Information
Dividend Withholding Tax Rates
Jun 28, 2018
This chart shows the dividend withholding tax (DWT) rates in Europe as of June 2018.
More Information
Gaming Industry
Jun 28, 2018
The chart shows the highest grossing free-2-play titles.
More Information
2018 FIFA World Cup
Jun 28, 2018
This chart shows the average length of stoppages over all World Cup match time combined (minutes per match).
More Information
Women
Jun 28, 2018
This chart shows the most dangerous countries for women ranked on 6 key criteria in 2018.
More Information
111
/
161
Contact
Get in touch with us. We are happy to help.
Do you still have questions?
Feel free to contact us anytime using our
contact form
or visit our
FAQ page
.
Your contact to the Infographics Newsroom
Felix Richter
Data Journalist
felix.richter@statista.com
+49 (40) 284 841 557