Skip to main content
Consumer Goods & FMCG
E-Commerce
Economy & Politics
Energy & Environment
Health, Pharma & Medtech
Internet
Media
Technology & Telecommunications
Transportation & Logistics
Travel, Tourism & Hospitality
View all industries
Global data volume growth
Global AI market size
Number of generative AI users worldwide
Global inflation rate
Retail e-commerce sales worldwide
Largest economies worldwide
Biggest social media platforms by users
Global EV market share by manufacturer
International tourist arrivals by world region
Global annual CO₂ emissions
Browse recent statistics
Artificial intelligence (AI) worldwide
TikTok
Nvidia
E-commerce worldwide
Global GDP
Instagram
Apparel market worldwide
Video gaming worldwide
Global renewable energy industry
Influencer marketing worldwide
Browse recent topics
Consumer Trends 2026
Artificial Intelligence: in-depth market analysis
E-commerce challenges
Global economy
TikTok
Luxury goods: in-depth market analysis
Electric vehicles: A global overview
Video gaming worldwide
Travel and tourism trends 2026
Battery recycling worldwide
Browse recent reports
Explore the tool
Explore Classic mode
Advertising & Media
eCommerce
Consumer
Finance
Global Indicators
Health
Industrial
Mobility
Technology
Explore Market Insights
eCommerce Insights
Research AI
Book a demo
All integrations
Developer docs
Explore Statista Connect
Research
Strategy & Consulting
Marketing
Media & PR
Explore AI assistants
Marketing
Research & Development
Strategy
Sales
Find the fact
Tell the story
Win the pitch
Understand the market
Develop your strategy
Academia
Agencies
Consultancies
Consumer goods
Finance
Tech
Research solutions
Strategy consulting
Communication services
Explore Statista+
Statista R
Statista Healthcare
About Statista
First steps & help center
Webinar & training hub
Success stories
Individuals & Small Teams
Businesses & Enterprises
Academia & Government
English
Deutsch
Daily Data
Infographics on the topic "statista trend"
Iran War
Jul 21, 2026
This chart shows the daily price per barrel of Brent crude oil since January 2008.
More Information
Content Consumption
Jul 16, 2026
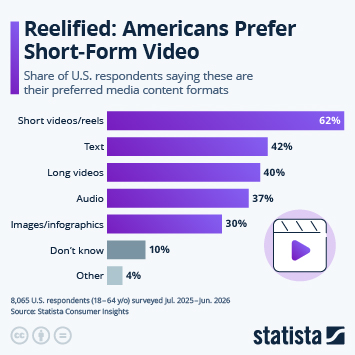
This chart ranks the most popular content formats in the U.S.
More Information
Urbanization
Jul 13, 2026
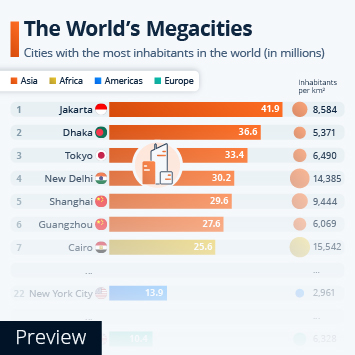
This chart shows the cities with the most inhabitants in the world.
More Information
Urbanization
Jul 13, 2026
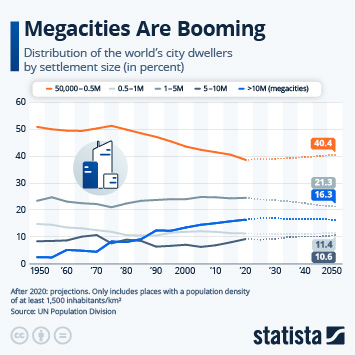
This chart shows the distribution of the world's city dwellers by settlement size.
More Information
Population Growth
Jul 10, 2026
This chart shows the share of annual U.S. population growth attributed to natural increase and net immigration.
More Information
Population Decline
Jul 10, 2026
This chart shows when selected countries' populations are expected to start declining.
More Information
Nike
Jul 9, 2026
This chart shows direct-to-consumer and wholesale sales as a percentage of total Nike brand revenue.
More Information
Data center power demand
Jul 2, 2026
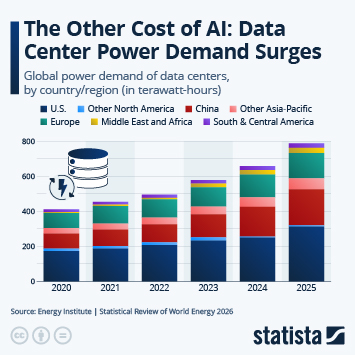
This chart shows the steady rise in global data center electricity demand.
More Information
National Fentanyl Awareness Day
Jun 26, 2026
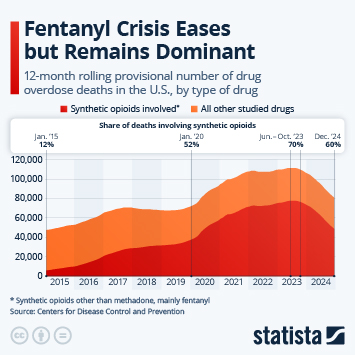
This infographic shows the 12-month rolling provisional number of drug overdose deaths in the U.S., including the share of synthetic...
More Information
Housing Market
Jun 25, 2026
This chart compares the median household income in the United States to the median price of new houses sold in the country.
More Information
Influencers
Jun 24, 2026
This chart shows the share of respondents in selected countries who have bought products because celebrities or influencers advertised...
More Information
Heatstroke
Jun 1, 2026
This chart shows the number of child heatstroke deaths in vehicles from 2008 to 2025.
More Information
Sponsored post by Booking.com
Jun 1, 2026
This infographic shows the share of accommodations that said their business performance was good or very good, by business type from...
More Information
Meat Consumption
May 29, 2026
This chart shows the share of respondents in selected countries who said they ate meat.
More Information
Women in politics
May 28, 2026
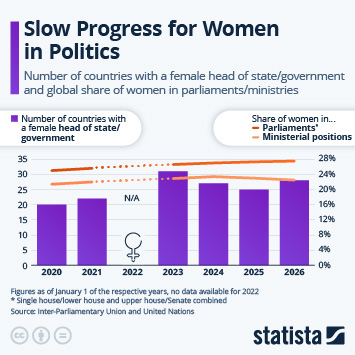
This infographic shows the number of countries with a female head of state/government and global share of women in parliaments/ministries.
More Information
Domestic Real Estate
May 27, 2026
This chart shows the monthly purchase-only index for house prices in the United States.
More Information
Housing Market
May 27, 2026
This chart shows the least affordable cities for housing worldwide, ranked by median home price-to-income ratio in 2026.
More Information
Electric vehicles
May 20, 2026
This chart shows the volume-weighted average of lithium-ion battery prices from all sectors (in USD).
More Information
Trade
May 18, 2026
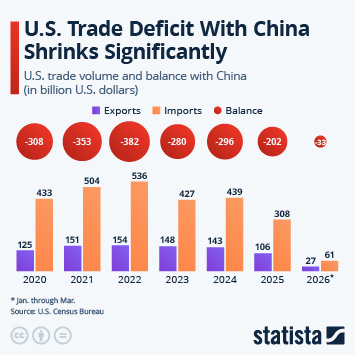
This chart shows U.S. trade volume and balance with China.
More Information
Fuel prices
May 8, 2026
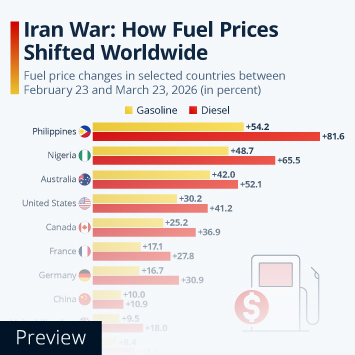
This infographic compares fuel price changes in selected countries between February 23 and May 4, 2026.
More Information
Gasoline prices
May 7, 2026
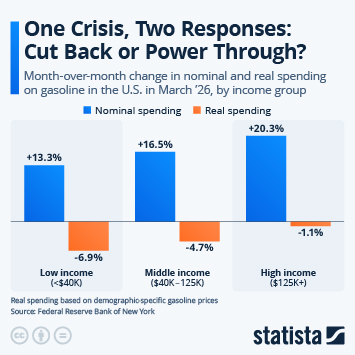
This chart shows how gasoline spending changed in March 2026 due to the steep price increase caused by the war in Iran and the blockage...
More Information
Gasoline Prices
May 7, 2026
This chart shows the average weekly price of gasoline in the U.S.
More Information
Russian Economy
May 6, 2026
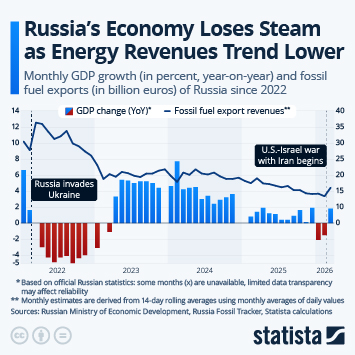
This chart shows the monthly GDP year-on-year growth and fossil fuel exports of Russia since 2022.
More Information
Jewelry
Apr 29, 2026
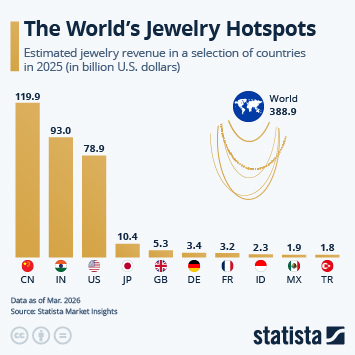
This chart shows estimated jewelry revenue in a selection of countries in 2025 (in billion U.S. dollars).
More Information
E-Books vs. Printed Books
Apr 23, 2026
This chart shows the estimated share of the population in selected countries that purchased an e-book / a printed book in 2025.
More Information
Electricity Worldwide
Apr 22, 2026
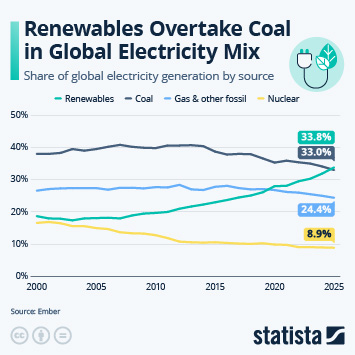
This chart shows the share of global electricity generation by source, between 2000 and 2025.
More Information
Energy
Apr 22, 2026
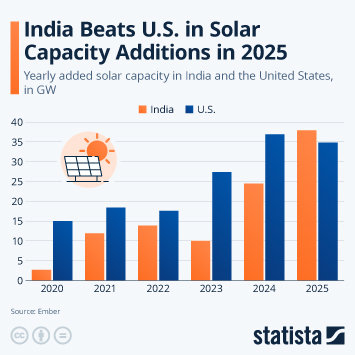
This infographic shows the yearly added solar capacity in India and the United States between 2021 and 2025, in GW.
More Information
Live Music
Apr 10, 2026
This chart shows estimated gross merchandise value of online ticket sales to music events worldwide.
More Information
Airlines
Apr 9, 2026
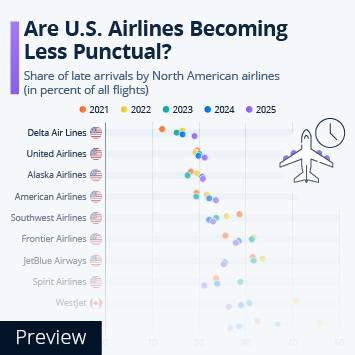
This chart shows the share of late arrivals by North American airlines.
More Information
Critical minerals
Apr 8, 2026
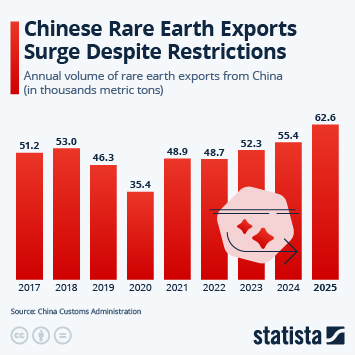
This chart shows the annual volume of rare earth exports from China between 2017 and 2025.
More Information
2
/
7
Contact
Get in touch with us. We are happy to help.
Do you still have questions?
Feel free to contact us anytime using our
contact form
or visit our
FAQ page
.
Your contact to the Infographics Newsroom
Felix Richter
Data Journalist
felix.richter@statista.com
+49 (40) 284 841 557