Skip to main content
Consumer Goods & FMCG
E-Commerce
Economy & Politics
Energy & Environment
Health, Pharma & Medtech
Internet
Media
Technology & Telecommunications
Transportation & Logistics
Travel, Tourism & Hospitality
View all industries
Global data volume growth
Global AI market size
Number of generative AI users worldwide
Global inflation rate
Retail e-commerce sales worldwide
Largest economies worldwide
Biggest social media platforms by users
Global EV market share by manufacturer
International tourist arrivals by world region
Global annual CO₂ emissions
Browse recent statistics
Artificial intelligence (AI) worldwide
TikTok
Nvidia
E-commerce worldwide
Global GDP
Instagram
Apparel market worldwide
Video gaming worldwide
Global renewable energy industry
Influencer marketing worldwide
Browse recent topics
Consumer Trends 2026
Artificial Intelligence: in-depth market analysis
E-commerce challenges
Global economy
TikTok
Luxury goods: in-depth market analysis
Electric vehicles: A global overview
Video gaming worldwide
Travel and tourism trends 2026
Battery recycling worldwide
Browse recent reports
Explore the tool
Explore Classic mode
Advertising & Media
eCommerce
Consumer
Finance
Global Indicators
Health
Industrial
Mobility
Technology
Explore Market Insights
eCommerce Insights
Research AI
Book a demo
All integrations
Developer docs
Explore Statista Connect
Research
Strategy & Consulting
Marketing
Media & PR
Explore AI assistants
Marketing
Research & Development
Strategy
Sales
Find the fact
Tell the story
Win the pitch
Understand the market
Develop your strategy
Academia
Agencies
Consultancies
Consumer goods
Finance
Tech
Research solutions
Strategy consulting
Communication services
Explore Statista+
Statista R
Statista Healthcare
About Statista
First steps & help center
Webinar & training hub
Success stories
Individuals & Small Teams
Businesses & Enterprises
Academia & Government
English
Deutsch
Daily Data
Infographics on the topic "statista trend"
Eurovision Song Contest
Apr 7, 2026
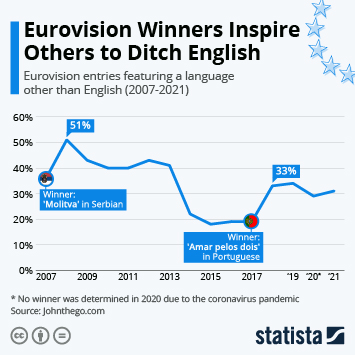
This chart shows the share of Eurovision entries featuring a language other than English (2007-2024).
More Information
Imports & Exports
Apr 2, 2026
This chart shows the balance of trade in goods and services of the United States from 2008 to 2025 (in billion U.S. dollars).
More Information
Sports Betting
Mar 26, 2026
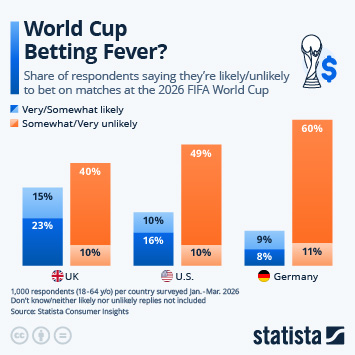
This chart shows how likely respondents from the UK, the U.S. and Germany said they are to bet on matches at the upcoming FIFA World...
More Information
Anti-Corruption and Integrity
Mar 24, 2026
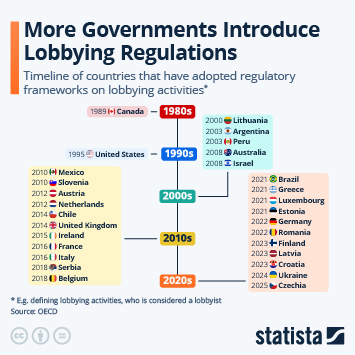
This infographic shows a timeline of countries that have adopted regulatory frameworks on lobbying activities (1989-2025).
More Information
Lobbying
Mar 24, 2026
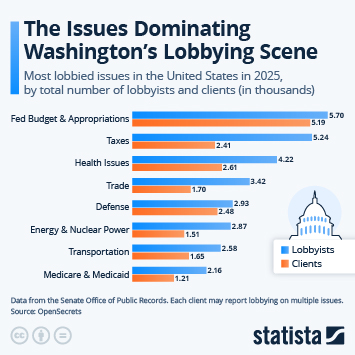
This infographic shows the most lobbied issues in the United States in 2025, by total number of lobbyists and clients (in thousands).
More Information
AI in Content Marketing
Mar 16, 2026
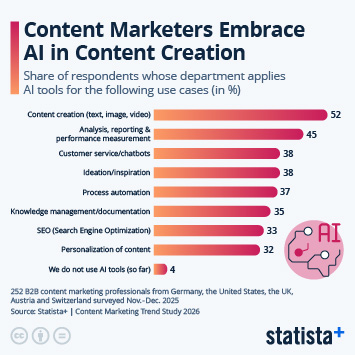
This chart shows for which tasks content marketing professionals currently use AI tools.
More Information
AI in Content Marketing
Mar 16, 2026
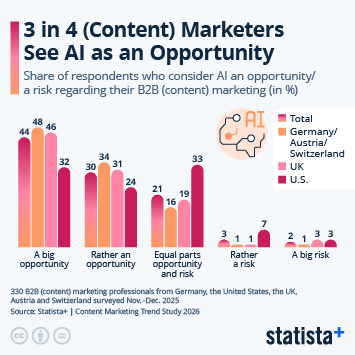
This chart shows if marketing professional see AI as an opportunity or a risk for their work.
More Information
AI in Content Marketing
Mar 16, 2026
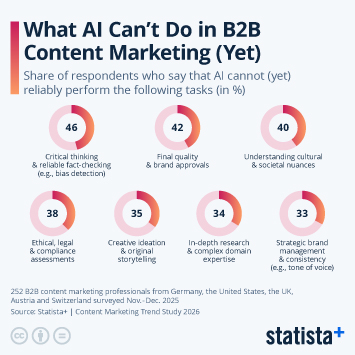
This chart shows which tasks content marketing professionals don't trust AI with.
More Information
Phone ownership in the U.S.
Mar 10, 2026
This chart shows how landline phones are gradually losing relevance in the United States.
More Information
Sportswear
Mar 4, 2026
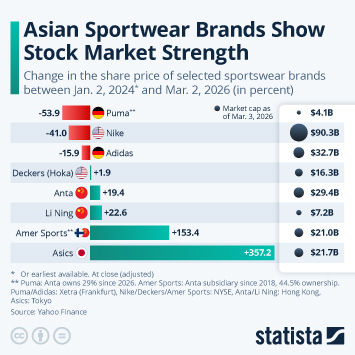
This chart shows the change in the share price of selected sportswear brands between Jan. 2, 2024 and Mar. 2, 2026 (in percent).
More Information
International Trade
Feb 25, 2026
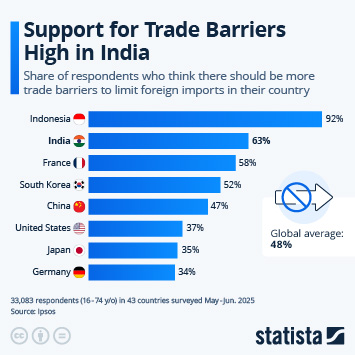
This infographic shows the share of respondents in selected countries who believe there should be more trade barriers to limit imports...
More Information
State of the Union
Feb 24, 2026
This chart shows TV ratings for presidential State of the Union addresses in the U.S. since 1993.
More Information
Tech Jobs
Feb 18, 2026
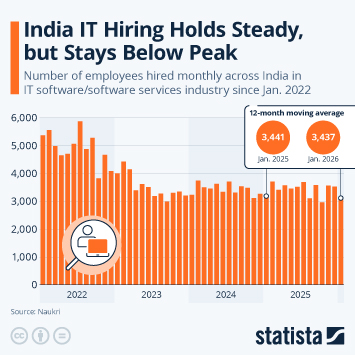
This infographic shows the number of employees hired monthly across India in the IT software/software services industry (from Jan....
More Information
Startups in India
Feb 18, 2026
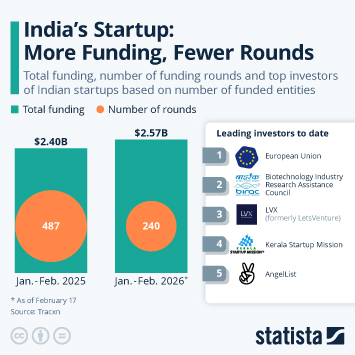
This chart indicates Indian startup funding and the number of rounds (Jan.-Feb. 2026 vs 2025), as well as the top investors based on...
More Information
Corruption Perceptions Index 2025
Feb 11, 2026
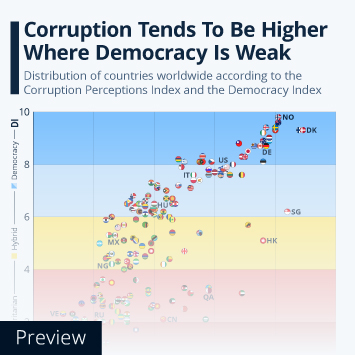
This infographic shows the distribution of countries worldwide according to the 2025 Corruption Perceptions Index and the Democracy...
More Information
United States
Feb 11, 2026
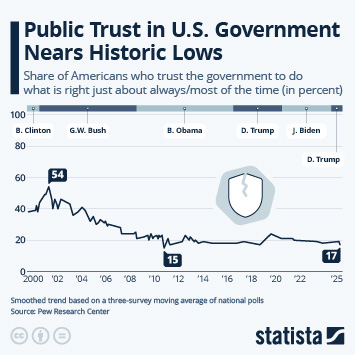
This chart shows the evolution of the share of U.S. people who say they trust the government to do what is right just about always/most...
More Information
Advertising
Feb 6, 2026
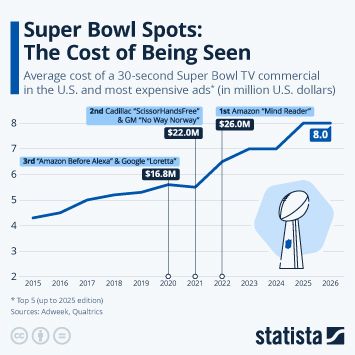
This infographic shows the average cost of a 30-second Super Bowl TV commercial in the U.S. and the top 5 most expensive ads (million...
More Information
Defense
Feb 5, 2026
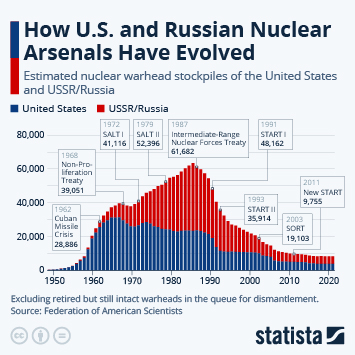
This chart shows the scale of stockpiled nuclear warheads of the United States and Russia since 1945.
More Information
Currencies
Feb 2, 2026
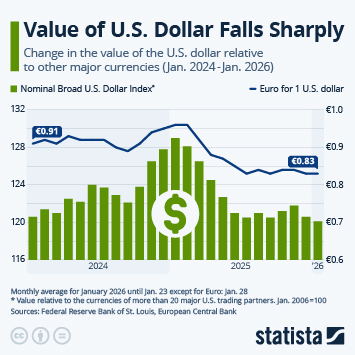
This chart shows the change in the value of the U.S. dollar relative to other major currencies (Jan. 2024-Jan. 2026).
More Information
Clothing
Jan 30, 2026
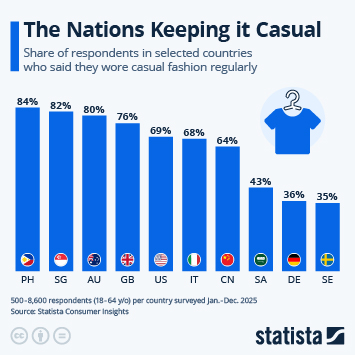
This chart shows the share of respondents in selected countries who said they wore casual fashion regularly.
More Information
De-dollarization
Jan 30, 2026
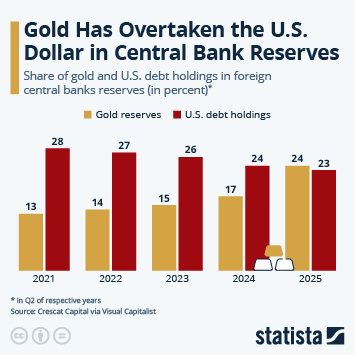
This chart shows the share of gold and U.S. debt holdings in foreign central banks reserves from Q2 2021 to Q2 2025.
More Information
China Population
Jan 22, 2026
This chart shows the total population and annual population growth rate in China.
More Information
International Day of Education
Jan 21, 2026
This chart shows the lower secondary school completion rate gender parity index, by country income group.
More Information
Tariffs
Jan 19, 2026
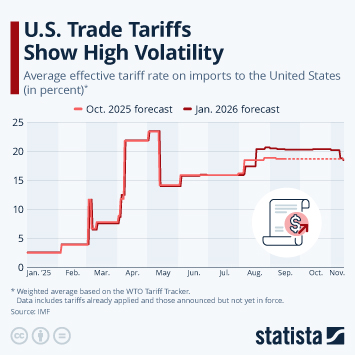
This chart shows the average effective tariff rate on imports to the United States (in percent).
More Information
EVs
Jan 8, 2026
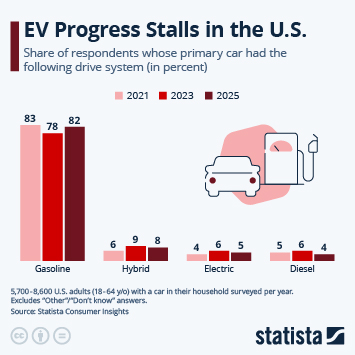
This chart shows the share of respondents whose primary car had the following drive system (in percent).
More Information
U.S. Labor Market
Dec 17, 2025
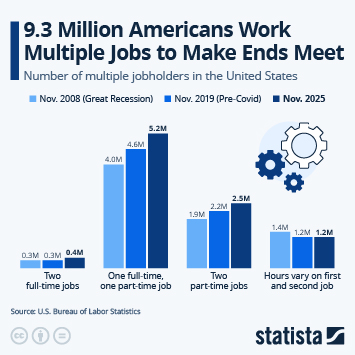
This chart shows the number of Americans working multiple jobs.
More Information
Eating behaviors
Nov 26, 2025
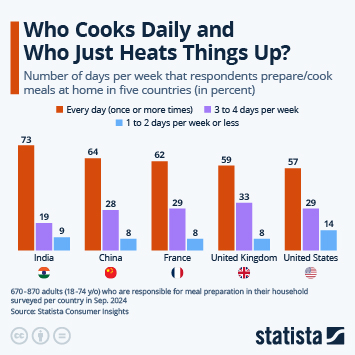
This chart shows the number of days per week respondents cook meals at home across five countries (in percent).
More Information
Print industry
Nov 26, 2025
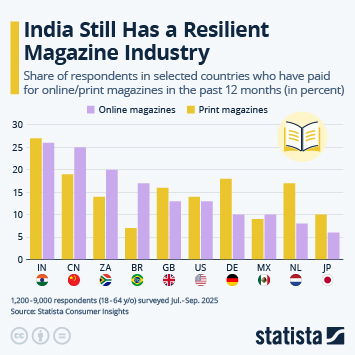
This chart shows the share of respondents in selected countries who have paid for online/print magazines in the past 12 months (in...
More Information
Print Advertising
Nov 26, 2025
This chart shows estimated print advertising revenue in the United States.
More Information
Health
Nov 19, 2025
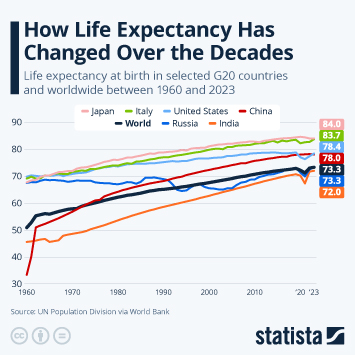
This infographic shows life expectancy at birth in selected G20 countries and worldwide between 1960 and 2023.
More Information
Trust
Nov 17, 2025
This chart shows how many people trust politicians, journalists, police officers and scientists in selected countries.
More Information
Global Issues
Nov 12, 2025
This chart shows the impact of terrorism according to the Global Guardian Terror Index 2026.
More Information
Online Retail
Nov 10, 2025
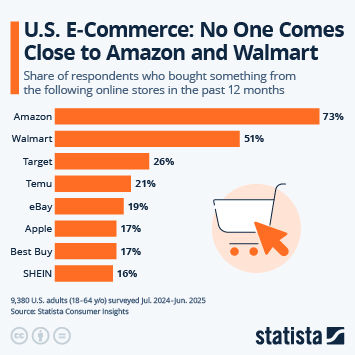
This chart ranks the most popular online retailers in the U.S. by share of consumers who made a purchase there in the past 12 months.
More Information
China Demography
Nov 10, 2025
This chart shows the number of new marriages and child births per 1,000 people in China.
More Information
Business
Nov 5, 2025
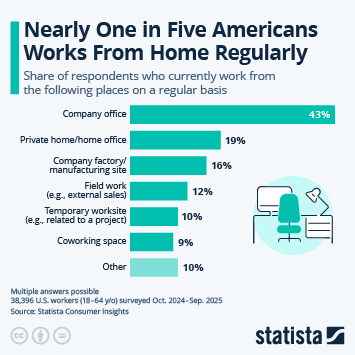
This chart shows the share of respondents who currently work from home or the office on a regular basis.
More Information
Chinese Espionage
Nov 3, 2025
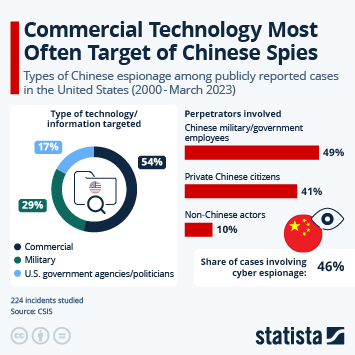
This chart shows types of Chinese espionage among publicly reported cases in the United States (2000- March 2023).
More Information
Gold
Oct 29, 2025
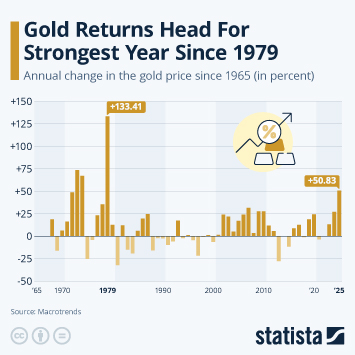
This chart shows the annual change in the gold price since 1965 (in percent).
More Information
Tesla
Oct 23, 2025
This chart shows the quarterly profit of Tesla.
More Information
Health
Oct 22, 2025
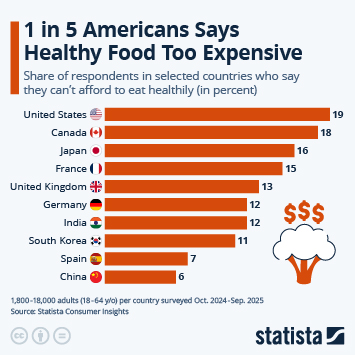
This chart shows the share of respondents in selected countries who say they can't afford healthy food (in percent).
More Information
Overweight
Oct 16, 2025
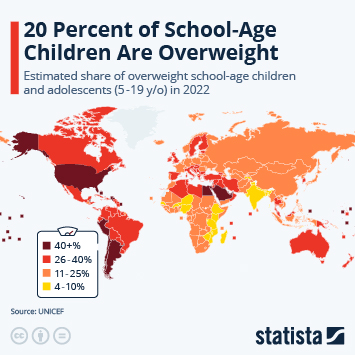
This chart shows the share of school-age children and adolescents considered overweight in 2022.
More Information
Childhood Overweight
Oct 16, 2025
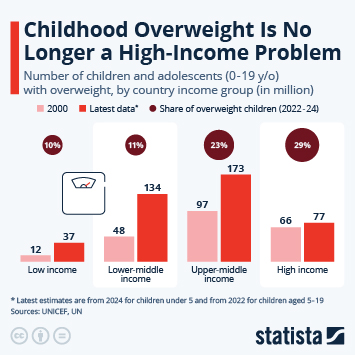
This chart shows the number of overweight school-age children and adolescents in 2000 and 2022/24.
More Information
Brand Activism
Oct 10, 2025
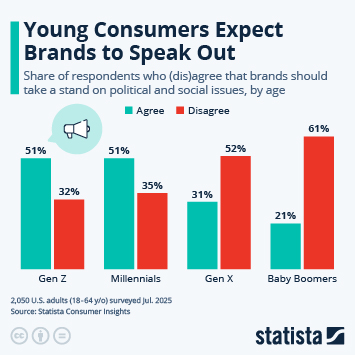
This chart shows the share of U.S. consumers who agree that brands should take a public stand on political and social issues, by generation.
More Information
Textiles
Oct 2, 2025
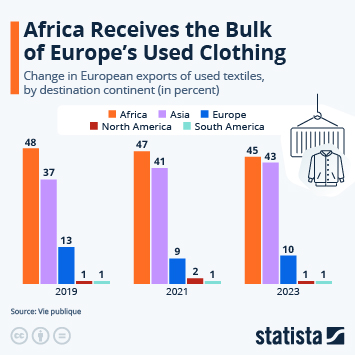
This chart shows the change in European exports of used textiles, by destination continent (in percent).
More Information
Employment trends
Sep 22, 2025
This chart shows the occupations with the highest projected change in employment in the U.S. between 2024 and 2034.
More Information
Education
Sep 16, 2025
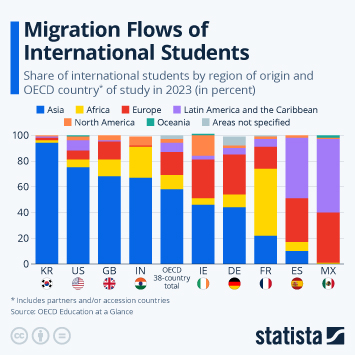
This chart shows the share of international students by region of origin and OECD country of study in 2023.
More Information
Education
Sep 15, 2025
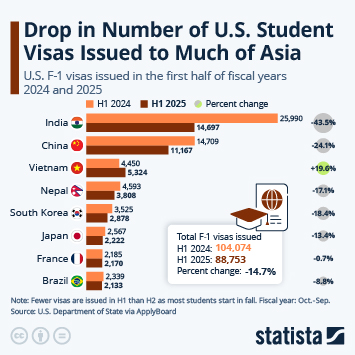
This chart shows U.S. F-1 visas issued in the first half of FY2024/25.
More Information
Education
Sep 15, 2025
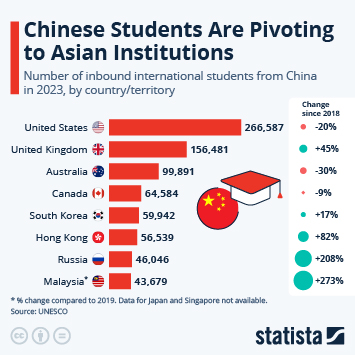
This chart shows the number of inbound international students from China in 2023, by country/territory.
More Information
Equal Pay Day
Sep 11, 2025
This chart shows the female-to-male earnings ratio for full-time, year-round workers aged 15+ in the United States since 1960.
More Information
IT Outsourcing
Sep 10, 2025
This chart shows the worldwide revenue of IT outsourcing (in billion U.S. dollars).
More Information
Chinese Trade
Sep 8, 2025
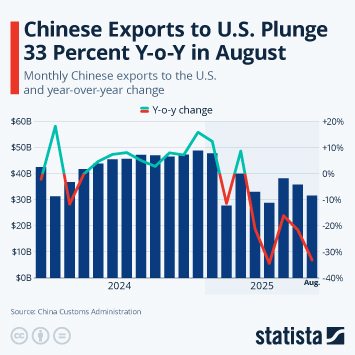
This chart shows monthly Chinese exports to the U.S. (in billion U.S. dollars) and change year-over-year.
More Information
Film Industry
Sep 5, 2025
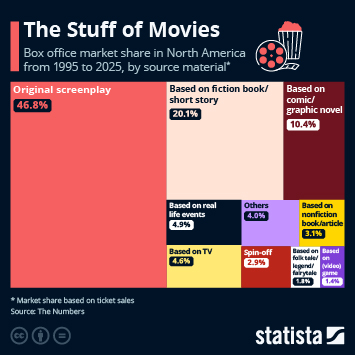
This chart shows the box office market share of movies based on different source material.
More Information
Disasters
Aug 29, 2025
This chart shows economic losses and insured losses from natural disasters (billion U.S. dollars).
More Information
Opioid Crisis
Aug 29, 2025
This chart shows the number of drug overdose deaths in the U.S. in 2023 involving different drugs.
More Information
Tropical Cyclones
Aug 29, 2025
This chart shows the number of hurricanes over the Atlantic basin by category (1967-2024).
More Information
Environment
Aug 22, 2025
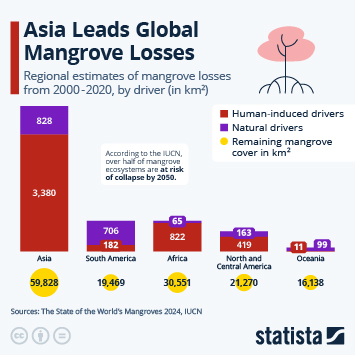
This chart shows the regional estimates of mangrove losses from 2000-2020, by driver.
More Information
Sexual health
Aug 14, 2025
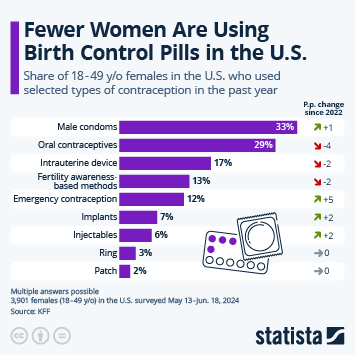
This chart shows the share of 18-49 year old females in the U.S. who used selected types of contraception in the past year.
More Information
Tesla
Jul 24, 2025
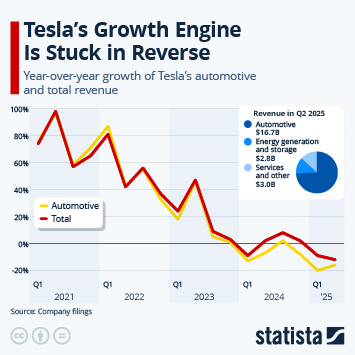
This chart shows Tesla's revenue growth since 2021.
More Information
Film Industry
Jul 21, 2025
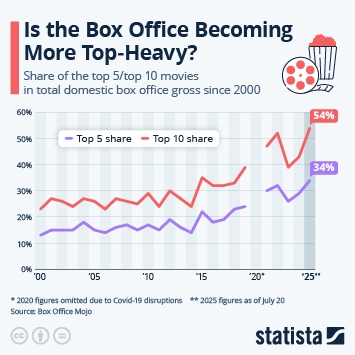
This chart shows the share of the top 5/top 10 movies in the annual box office in North America since 2000.
More Information
World Emoji Day
Jul 17, 2025
This chart shows the number of emojis from 1995 to 2026 (recommended) as well as the release date of notable emojis.
More Information
Aging Society
Jul 7, 2025
This chart shows the countries/territories with the highest share of people aged 65 and older in 2025 and 2050.
More Information
Tesla
Jul 3, 2025
This chart shows Tesla's quarterly vehicle deliveries.
More Information
Climate Change
Jun 23, 2025
This chart shows the mean trend in temperature increases by continent (in °C/decade).
More Information
State of the Mediterranean Sea
Jun 6, 2025
This chart shows the surface temperature anomalies of the Mediterranean Sea from 1994 to 2023.
More Information
U.S. Trade
Jun 2, 2025
This chart shows the monthly U.S. trade in goods.
More Information
Immigration
May 21, 2025
This chart shows the number of people entering the U.S. illegally vs. people who overstay their visas in FY 2023.
More Information
Budget Proposal
May 13, 2025
This chart shows the number and percentage of persons without health insurance coverage in the United States.
More Information
U.S. labor market
Apr 29, 2025
This chart shows the number of people quitting their jobs per month in the United States.
More Information
U.S. Labor Market
Apr 28, 2025
This chart shows the median year-over-year change in annual pay in the U.S., comparing workers who changed jobs to those who stayed...
More Information
Fertility
Apr 25, 2025
This chart shows the fertility rate by country in 2023 (in births per woman).
More Information
Infant Mortality
Apr 7, 2025
This chart shows infant deaths per 1,000 live births in the U.S. (1995-2023).
More Information
SIPRI
Mar 10, 2025
This chart shows the share of global exports of major conventional weapons systems and components.
More Information
Gaming
Mar 7, 2025
This chart shows the share of female respondents who regularly use PCs and game consoles to play video games.
More Information
Russia-Ukraine War
Feb 24, 2025
This chart shows the countries with the largest number of Ukrainian refugees recorded since Feb. 24, 2022.
More Information
Global Politics
Feb 11, 2025
This chart shows countries and territories ranked on perceived public sector corruption in 2024.
More Information
U.S. Sports
Feb 7, 2025
This chart shows the popularity of American football and basketball in the United States, by age group.
More Information
Sponsored post from Booking.com
Jan 29, 2025
This infographic shows construction and renovation investment allocations in the European hotel sector in 2024.
More Information
Year of the Dragon
Jan 29, 2025
This chart shows live births per 1,000 people in China (1980-2024).
More Information
Presidential Ages
Jan 17, 2025
This chart shows the ages of U.S. presidents at the time of their inauguration (in years).
More Information
AI
Jan 15, 2025
This chart shows the share of knowledge workers* who say they would not hire someone without AI skills, by country.
More Information
E-Commerce
Nov 26, 2024
This chart shows the share of e-commerce sales in total retail sales in the United States.
More Information
Adoption
Nov 22, 2024
This chart shows the number of children in public adoption in the United States, by fiscal year.
More Information
Household Finances
Nov 7, 2024
This chart shows estimated cumulative excess savings built up during the pandemic and drawn down since
More Information
U.S. Elections
Oct 30, 2024
This chart shows the share of respondents with the following presidential voting intentions in 2024, by age and gender.
More Information
Marketer Trust in X
Oct 25, 2024
This chart shows the eroding trust that marketers put in X, formerly Twitter, as an advertising platform.
More Information
Hate Crime
Oct 21, 2024
This chart shows a timeline of the number of hate crime incidents reported to the FBI in the United States.
More Information
music streaming
Sep 30, 2024
This chart shows the share UK and U.S. respondents that have used the following audio streaming services in the past year.
More Information
Violent crime in the U.S.
Sep 13, 2024
This chart shows the estimated share of violent victimization by victim-offender relationship in the U.S. by reported sex.
More Information
Dairy-substitute products
Aug 21, 2024
This chart shows the countries and regions with the highest respondent share regularly consuming dairy-substitute products.
More Information
Music Consumption
Aug 16, 2024
This chart shows music album sales in the United States.
More Information
Boeing
Aug 8, 2024
This chart shows safety incidents and number of injuries on Boeing planes in the U.S. (2014-2023).
More Information
3
/
7
Contact
Get in touch with us. We are happy to help.
Do you still have questions?
Feel free to contact us anytime using our
contact form
or visit our
FAQ page
.
Your contact to the Infographics Newsroom
Felix Richter
Data Journalist
felix.richter@statista.com
+49 (40) 284 841 557