Skip to main content
Consumer Goods & FMCG
E-Commerce
Economy & Politics
Energy & Environment
Health, Pharma & Medtech
Internet
Media
Technology & Telecommunications
Transportation & Logistics
Travel, Tourism & Hospitality
View all industries
Global data volume growth
Global AI market size
Number of generative AI users worldwide
Global inflation rate
Retail e-commerce sales worldwide
Largest economies worldwide
Biggest social media platforms by users
Global EV market share by manufacturer
International tourist arrivals by world region
Global annual CO₂ emissions
Browse recent statistics
Artificial intelligence (AI) worldwide
TikTok
Nvidia
E-commerce worldwide
Global GDP
Instagram
Apparel market worldwide
Video gaming worldwide
Global renewable energy industry
Influencer marketing worldwide
Browse recent topics
Consumer Trends 2026
Artificial Intelligence: in-depth market analysis
E-commerce challenges
Global economy
TikTok
Luxury goods: in-depth market analysis
Electric vehicles: A global overview
Video gaming worldwide
Travel and tourism trends 2026
Battery recycling worldwide
Browse recent reports
Explore the tool
Explore Classic mode
Advertising & Media
eCommerce
Consumer
Finance
Global Indicators
Health
Industrial
Mobility
Technology
Explore Market Insights
eCommerce Insights
Research AI
Book a demo
All integrations
Developer docs
Explore Statista Connect
Research
Strategy & Consulting
Marketing
Media & PR
Explore AI assistants
Marketing
Research & Development
Strategy
Sales
Find the fact
Tell the story
Win the pitch
Understand the market
Develop your strategy
Academia
Agencies
Consultancies
Consumer goods
Finance
Tech
Research solutions
Strategy consulting
Communication services
Explore Statista+
Statista R
Statista Healthcare
About Statista
First steps & help center
Webinar & training hub
Success stories
Individuals & Small Teams
Businesses & Enterprises
Academia & Government
English
Deutsch
Daily Data
Infographics on the topic "uk"
UK
Sep 30, 2021
This chart shows the share of GB adults that think Brexit is going well or badly in 2021.
More Information
Economy
Sep 30, 2021
This chart shows the UK quarterly real GDP index from Q1 2008 to Q2 2021.
More Information
Brand Value
Sep 29, 2021
This chart shows the brand value of the most valuable brands in the United Kingdom in 2021.
More Information
Real-Time Payments
Sep 28, 2021
This chart shows the transaction value of real-time payments in 2020, by country (in billion U.S. dollars).
More Information
Social Media Usage
Sep 28, 2021
This chart shows the percentage of TikTok users in the last 12 months by country.
More Information
Health
Sep 24, 2021
This chart shows alcohol-specific death rates per 100,000 people in the UK in 2001 and 2019, by age group. alcoholic liver disease
More Information
Economy
Sep 24, 2021
This chart shows the estimated number of large goods vehicle drivers in the UK.
More Information
Podcast Listening Habits
Sep 24, 2021
This chart shows the percentage of podcast listeners around the world.
More Information
Armed Forces
Sep 23, 2021
This chart shows the share of active duty military personnel which is female in selected countries in 2019 (in percent).
More Information
Country reputations in the public eye
Sep 23, 2021
This chart shows the countries with most respondents with favorable views towards the U.S. or China.
More Information
The Pokémon Company
Sep 23, 2021
This chart shows the net income of the Pokémon Company by fiscal year.
More Information
Energy
Sep 22, 2021
Chinese public investment in foreign coal power as of September 2021, by recipient country.
More Information
Record Companies
Sep 22, 2021
This chart shows the global digital and physical revenue market share of largest record companies.
More Information
Submarine warfare
Sep 21, 2021
This chart shows the number of military submarines in service by country.
More Information
Society
Sep 20, 2021
This chart shows conceptions per 1,000 women aged 15-17 in England & Wales in 2020, by region.
More Information
Health
Sep 13, 2021
This chart shows Covid-19 related deaths in England in 2021 by vaccination status.
More Information
GDP in Europe
Sep 10, 2021
This chart shows the European countries and regions with the lowest GDPs in 2019.
More Information
Economy
Sep 10, 2021
This chart shows the UK GDP monthly index from 2007 to 2021.
More Information
War on Terror
Sep 10, 2021
This chart shows civilians killed in U.S. airstrikes in Afghanistan, Iraq and Syria since 9/11/2001.
More Information
Mental Health
Sep 9, 2021
This chart shows the number of suicides per 100,000 population in 2020 in England and Wales, by region.
More Information
Paralympic Games
Sep 9, 2021
This chart shows the medal count for Paralympic Games 2021.
More Information
Society
Sep 7, 2021
This chart shows the share of GB adults who felt “very or fairly unsafe” walking alone, by setting and gender in 2021.
More Information
Economy
Sep 6, 2021
This infographic charts the material prices index for all construction work in the UK from January 2016 to July 2021.
More Information
Sport
Aug 31, 2021
This chart shows the football merchandise most and least commonly owned by UK football fans in 2021.
More Information
Global Consumer Survey
Aug 30, 2021
This chart shows the share of UK adults that have experienced physical pain in the last 12 months, by type in 2021.
More Information
Politics
Aug 27, 2021
This chart shows the results of a survey into favourability in the UK of major world leaders in 2021.
More Information
Statista Survey
Aug 27, 2021
This chart shows the share of UK respondents who have experienced certain mental health issues in the past 12 months.
More Information
Franchises
Aug 27, 2021
This chart shows the francise fee and total estimated cost of opening a Subway restaurant in selected countries (2021).
More Information
Auto industry
Aug 26, 2021
This chart shows the number of cars manufactured in the UK in July of each year from 2011 to 2021.
More Information
Health
Aug 25, 2021
This chart shows the share of UK respondents agreeing with the specific statements on medical cannabis/CBD in 2021.
More Information
Digital Wellbeing
Aug 25, 2021
This chart shows approximate screen time per day in the UK, US and Germany.
More Information
Food
Aug 24, 2021
This chart shows the most popular UK dining brands in 2021.
More Information
Safe Cities Index
Aug 24, 2021
This chart shows the 10 cities scoring highest in the EIU Safe Cities Index 2021.
More Information
Society
Aug 20, 2021
This chart shows GB adult responses to the question: ""Do you think the UK has a moral obligation to offer asylum to Afghan refugees...
More Information
Life
Aug 20, 2021
This chart shows UK and US responses to the question ""Which of the following animals, if any, do you think you could beat in a fight...
More Information
Society
Aug 19, 2021
This chart shows the highest shares of people in European countries that think the level of health risk from Covid-19 tends to be overstated...
More Information
Covid-19
Aug 19, 2021
This chart shows the estimated share of the UK population with SARS-CoV-2 antibodies in July 2021, by country.
More Information
COVID-19 Vaccines
Aug 19, 2021
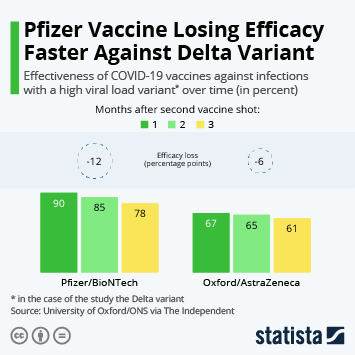
This chart show the effectiveness of COVID-19 vaccines against infections with a high viral load variant over time (in percent).
More Information
Overseas Military Bases
Aug 18, 2021
This chart shows Countries where permanent U.N. Security Council members have foreign military bases (2021).
More Information
Afghanistan
Aug 18, 2021
This chart shows selected countries by number of Afghan refugees they are hosting (2020).
More Information
Venture Capital
Aug 16, 2021
This chart shows shares of corporate venture capital deals by continent.
More Information
Football
Aug 13, 2021
This chart shows the Premier League clubs which the most fans say they love or hate in 2021.
More Information
Food delivery services in the UK
Aug 13, 2021
The chart shows the most popular food delivery services in the UK.
More Information
Economy
Aug 12, 2021
This chart looks at monthly changes in GDP in June 2021 of UK services industries.
More Information
Manufacturing industry in the UK
Aug 11, 2021
The chart shows UK manufacturers' sales by product category.
More Information
Tokyo Olympics
Aug 9, 2021
This chart shows the medals won in the Tokyo Summer Olympics by the top 10 most successful countries (by gold medals).
More Information
UK beer preferences
Aug 6, 2021
The chart shows the most popular beer categories in the UK.
More Information
Tourism
Aug 5, 2021
This chart shows how countries are rated by the UK for travel during the Covid-19 pandemic as of 8 Aug 2021.
More Information
Delta Variant
Aug 5, 2021
This chart shows the number of Delta variant infections in the previous four weeks and share of total new COVID-19 infections in selected...
More Information
Healthcare in high-income countries
Aug 5, 2021
The chart shows the ranking of selected countries according to their healthcare system.
More Information
Digital video and TV in the UK
Aug 4, 2021
The chart shows the percentage of people watching digital video or TV for a given amount of hours in the UK.
More Information
Professional sports and neurodegenerative disease
Aug 3, 2021
The chart show the percentage of former football players with neurodegenerative diseases by position.
More Information
Surviving the Apocalypse
Aug 2, 2021
This chart shows the most favorable starting locations/countries in the event of global societal collapse (2021).
More Information
UNESCO World Heritage
Jul 30, 2021
The chart shows the number of UNESCO world heritage sites per region.
More Information
Car manufacturing and corona
Jul 29, 2021
The chart shows the cars produced in the UK since its first lockdown per month.
More Information
Digital and analogue music in the UK
Jul 28, 2021
The chart shows the percentage of people listening to music for a given amount of hours in the UK.
More Information
Homelessness
Jul 27, 2021
This chart shows the estimated number of people sleeping rough in England from 2010 to 2020.
More Information
Digital Currencies
Jul 27, 2021
The chart shows the status of central bank digital currencies in Europe.
More Information
Football
Jul 16, 2021
This chart shows European football fans' opinions on VAR in 2021.
More Information
Fintech
Jul 16, 2021
This chart shows the most valuable private companies in the UK in July 2021.
More Information
Society
Jul 15, 2021
This chart shows football fans' views on how social media platforms deal with racism on their platforms.
More Information
Spending Money
Jul 8, 2021
This chart shows the growth or decline of disposable incomes in OECD and affiliated countries.
More Information
Cryptocurrencies
Jul 7, 2021
This chart shows operational crypto ATMs by country in 2021.
More Information
Covid-19
Jul 6, 2021
This chart shows the share of the public which support or oppose the removal of UK lockdown restrictions in the summer of 2021.
More Information
Pandemic
Jul 1, 2021
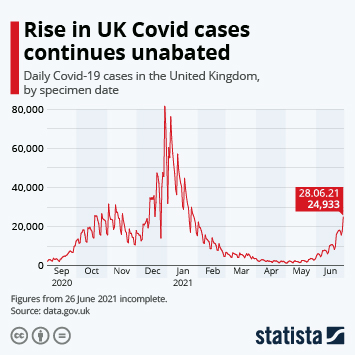
This chart shows the daily reported lab-confirmed Covid-19 cases in the United Kingdom.
More Information
Air Travel
Jun 29, 2021
This chart shows commercial airspace by risk level as of June 24, 2021.
More Information
Science
Jun 28, 2021
This chart shows GB survey responses to questions about the existence of aliens and UFOs in 2021.
More Information
Plastic Pollution
Jun 25, 2021
This chart shows the most prevalent forms of plastic waste detected in European waterways.
More Information
Pandemic
Jun 25, 2021
This chart shows the average change in minutes spent on activities per day in Great Britain (28 Mar-26 Apr 2020 to 20-28 Mar 2021).
More Information
Manufacturing
Jun 25, 2021
This chart shows the number of cars manufactured in the UK in May of 2019, 2020 and 2021.
More Information
Healthcare
Jun 23, 2021
This chart shows the most common non-UK/British nationalities of NHS England staff in 2020.
More Information
European Union
Jun 21, 2021
This chart shows the estimated number of violent war-related deaths in Europe since 1800.
More Information
Health
Jun 18, 2021
This chart shows the share of people in the UK with a new Covid-19 infection after vaccination, by vaccine type and dose number.
More Information
Real Estate
Jun 15, 2021
This chart shows the average amount it is cheaper/more expensive to rent than to buy a home in Great Britain in 2021.
More Information
World Cup
Jun 11, 2021
This chart shows the results of matches between England and Croatia and key facts for both teams.
More Information
Wealth
Jun 10, 2021
This chart shows countries holding the highest value of private offshore wealth in 2020.
More Information
Pandemic
Jun 9, 2021
This chart shows public attitudes in England to potential easing of Covid restrictions in June 2021.
More Information
Survey
Jun 8, 2021
This chart presents the results of the survey question: "Which one of the following insects/bugs/creepy-crawlies do you dislike the...
More Information
Coronavirus
Jun 4, 2021
This chart shows the estimated share of the England population age groups testing positive for Covid-19 (week ending 29 May 2021).
More Information
Politics
Jun 3, 2021
This chart shows UK spending on Overseas Development Aid as a share of gross national income from 1970 to 2020.
More Information
Energy Investment
Jun 3, 2021
This chart shows public money commited to forms of energy in G7 countries (Jan 2020 - Mar 2021).
More Information
Covid-19
Jun 2, 2021
This chart shows growth in healthcare expenditure in the UK from 1998 to 2020.
More Information
Mobility
May 31, 2021
This chart shows the change in financial cost of travel in the UK from May 2011 to April 2021, by type and compared to the cost of...
More Information
Economy
May 27, 2021
This chart shows the change in total UK goods imports from top five import partners from Q1 2018 to Q1 2021.
More Information
GDP Growth
May 27, 2021
This chart shows 2021 Q1 GDP growth in selected countries.
More Information
Facebook
May 27, 2021
This chart shows coordinated Inauthentic Behavior networks removed by Facebook by country of origin (2017-2020)*.
More Information
COVID-19 Vaccines
May 26, 2021
This chart shows COVID-19 vaccine candidates by clinical trial phase and national origin (as of May 25, 2021).
More Information
Economy
May 25, 2021
This chart shows UK public sector net borrowing excluding public sector banks from 1993 to 2021.
More Information
Beekeeping
May 20, 2021
This chart shows the number of beehives by world region in 1969 and 2019.
More Information
Covid-19 Pandemic
May 19, 2021
This chart shows the number of vaccine doses produced and exported as of March 2021.
More Information
8
/
25
Contact
Get in touch with us. We are happy to help.
Do you still have questions?
Feel free to contact us anytime using our
contact form
or visit our
FAQ page
.
Your contact to the Infographics Newsroom
Felix Richter
Data Journalist
felix.richter@statista.com
+49 (40) 284 841 557