Skip to main content
Consumer Goods & FMCG
E-Commerce
Economy & Politics
Energy & Environment
Health, Pharma & Medtech
Internet
Media
Technology & Telecommunications
Transportation & Logistics
Travel, Tourism & Hospitality
View all industries
Global data volume growth
Global AI market size
Number of generative AI users worldwide
Global inflation rate
Retail e-commerce sales worldwide
Largest economies worldwide
Biggest social media platforms by users
Global EV market share by manufacturer
International tourist arrivals by world region
Global annual CO₂ emissions
Browse recent statistics
Artificial intelligence (AI) worldwide
TikTok
Nvidia
E-commerce worldwide
Global GDP
Instagram
Apparel market worldwide
Video gaming worldwide
Global renewable energy industry
Influencer marketing worldwide
Browse recent topics
Consumer Trends 2026
Artificial Intelligence: in-depth market analysis
E-commerce challenges
Global economy
TikTok
Luxury goods: in-depth market analysis
Electric vehicles: A global overview
Video gaming worldwide
Travel and tourism trends 2026
Battery recycling worldwide
Browse recent reports
Explore the tool
Explore Classic mode
Advertising & Media
eCommerce
Consumer
Finance
Global Indicators
Health
Industrial
Mobility
Technology
Explore Market Insights
eCommerce Insights
Research AI
Book a demo
All integrations
Developer docs
Explore Statista Connect
Research
Strategy & Consulting
Marketing
Media & PR
Explore AI assistants
Marketing
Research & Development
Strategy
Sales
Find the fact
Tell the story
Win the pitch
Understand the market
Develop your strategy
Academia
Agencies
Consultancies
Consumer goods
Finance
Tech
Research solutions
Strategy consulting
Communication services
Explore Statista+
Statista R
Statista Healthcare
About Statista
First steps & help center
Webinar & training hub
Success stories
Individuals & Small Teams
Businesses & Enterprises
Academia & Government
English
Deutsch
Daily Data
Infographics on the topic "uk"
Politics
May 17, 2021
This chart represents government approval rates in the United Kingdom.
More Information
Beauty Pageants
May 17, 2021
This chart shows the countries with the most Big Four international beauty pageant titles.
More Information
Apple
May 14, 2021
This chart shows the total number of Apple Stores worldwide as of May 14, 2021.
More Information
Free Trade
May 12, 2021
This world map shows how many trade agreements different countries have entered.
More Information
New privacy policy
May 12, 2021
This chart shows the share of survey respondents saying they regularly use WhatsApp.
More Information
Train journeys
May 11, 2021
This chart shows the longest direct rail journeys that do not involve changing train (by distance).
More Information
Media consumption
May 10, 2021
This chart shows a ranking of the news websites with the most paid subscribers in the world.
More Information
UK Politics
May 7, 2021
This chart shows the results of recent parliamentary elections in Hartlepool.
More Information
Covid-19
May 6, 2021
This chart shows the share of the public that think certain Covid-19 vaccines are somewhat/very safe.
More Information
Covid-19 Outbreak
May 6, 2021
This chart shows the main recipients of Covid-19 vaccine R&D investments as of March 2021.
More Information
COVAX
May 5, 2021
This chart shows donations to COVAX-AMC.
More Information
COVID-19
May 3, 2021
This chart shows the low and middle income countries with the highest daily demand of medical oxygen to treat COVID-19 (in cylinders*).
More Information
COVID-19
Apr 30, 2021
This chart shows the 7-day rolling average of daily new COVID-19 cases per million of population in selected European countries (2021).
More Information
Covid-19
Apr 29, 2021
This chart shows the share of British adults that are Covid-19 vaccine willing/hesitant.
More Information
COVID-19
Apr 29, 2021
This chart shows the highest-ranked countries/regional economies on the Bloomberg COVID Resilience Ranking (as of April 26, 2021).
More Information
Workplace Accidents
Apr 29, 2021
This chart shows the number of fatal workplace accidents per 100,000 workers in Europe.
More Information
Defense
Apr 26, 2021
This chart shows compares military expenditure in 2020.
More Information
COVID-19
Apr 23, 2021
This chart shows the share of respondents from selected countries who said they would get/have gotten vaccinated against COVID-19 (in...
More Information
Tech
Apr 22, 2021
This chart shows the share of adults that regularly use fitness apps on their smartphone in 2021.
More Information
K-Pop
Apr 20, 2021
This chart shows the growth of recorded music revenue in selected countries and regions (2019 to 2020).
More Information
Sport
Apr 19, 2021
This chart shows the football clubs with the most top-6 finishes in the English top flight over the last five decades.
More Information
European Super League
Apr 19, 2021
This chart shows the estimated revenue of the highest-earning football clubs in the world in the 2019/2020 season.
More Information
COVID-19
Apr 16, 2021
This chart shows survey responses from selected countries on how long it will take to return to a pre-COVID life (as of Feb/Mar 2021).
More Information
UK Politics
Apr 15, 2021
This chart shows the extent to which the British public is aware of/following the David Cameron/Greensill Capital story.
More Information
Pandemic
Apr 15, 2021
This chart compares the annual change to quarterly GDP in selected countries in 2020 compared to the OECD average.
More Information
Pandemic
Apr 13, 2021
This chart shows the 7-day average new Covid-19 cases per 100,000 inhabitants in selected European countries in April 2021.
More Information
Lockdown
Apr 12, 2021
This chart shows the share of UK CFOs who expect the bulk of their workforce to return to working in the office, by period.
More Information
Travel
Apr 12, 2021
This chart shows the change in Heathrow Airport passenger volume in 2020 and 2021.
More Information
COVID-19 Vaccine rollout
Apr 7, 2021
This chart shows how many COVID-19 vaccine doses per 100 people have been administered in the EU, UK and United States.
More Information
Covid-19 Pandemic
Apr 7, 2021
This chart shows export requests for Covid-19 vaccine doses granted by the EU.
More Information
Covid-19
Apr 6, 2021
This chart shows the seven-day average number of Covid-19 vaccinations given in the UK in 2021.
More Information
COVID-19
Apr 1, 2021
This chart shows the 7-day rolling average of daily new COVID-19 cases per million of population in the most affected U.S. states.
More Information
Tourism
Apr 1, 2021
This chart shows the UK attractions with the largest annual decreases in visitor numbers in 2020.
More Information
Frequent Flyers
Mar 31, 2021
Estimated share of the population who take the largest total share of flights.
More Information
COVID-19 Second Wave
Mar 23, 2021
This chart shows coronavirus restrictions imposed in Europe during the second wave of the coronavirus pandemic (as of March 12, 2021).
More Information
Covid-19 Outbreak
Mar 23, 2021
This chart shows cumulative expected vaccine deliveries to the EU-27, Norway & Iceland in 2021.
More Information
Coronavirus
Mar 19, 2021
This chart presents a comparison of cumulative monthly UK government borrowing in 2019/20 and 2020/21.
More Information
Current Affairs
Mar 18, 2021
This chart shows the countries with the most ECHR judged violations of the European Convention on Human Rights in 2020.
More Information
Arms Industry
Mar 16, 2021
This chart shows the countries importing the highest value in arms from the UK from 2016 to 2020.
More Information
Arms Industry
Mar 16, 2021
This chart shows the countries that imported arms from the UK between 2016 and 2020.
More Information
Crime
Mar 15, 2021
This infographic presents figures related to female homicide victims in England & Wales in 2019-20.
More Information
United Kingdom
Mar 15, 2021
This chart shows the share of British women saying they have been sexually harassed in public in last 5 years.
More Information
Economy
Mar 12, 2021
This chart shows the change in UK trade from December 2020 to January 2021.
More Information
United Kingdom
Mar 10, 2021
This charts shows episodes of TV shows prompting the most complaints from UK viewers since 2011.
More Information
Retail
Mar 5, 2021
This chart shows annual change in UK retail spending in leisure sector markets in 2020.
More Information
Budget 2021
Mar 3, 2021
This chart shows tax as a share of nominal GDP in the UK since 1948.
More Information
Covid-19
Mar 2, 2021
This chart shows the change in movements in the UK after the coronavirus lockdown as recorded by Google location data, by category.
More Information
COVID-19
Mar 1, 2021
This chart shows COVID-19 deaths per 100,000 of the population in the 10 worst affected countries.
More Information
Homelessness
Feb 26, 2021
This chart looks at figures related to rough sleeping in England in January 2021 and the effects of a government initiative to reduce...
More Information
E-Waste
Feb 25, 2021
This chart shows the countries producing the most e-waste per capita in 2019.
More Information
Health
Feb 25, 2021
This chart presents the results and projected effects of England's 2003 salt reduction programme.
More Information
Travel
Feb 24, 2021
This chart compares selected KPIs of Heathrow Airport in 2019 and 2020.
More Information
Covid-19
Feb 23, 2021
This chart shows the unemployment rate in the UK.
More Information
COVID-19 Deaths
Feb 22, 2021
This chart shows cumulative COVID-19 deaths for the worst affected countries as of February 21, 2021.
More Information
New Survey
Feb 22, 2021
This chart shows supermarket chains in the UK ranked by customer satisfaction in 2020.
More Information
Health
Feb 18, 2021
This chart shows the Covid-19 cases reported per 1,000 tests conducted in the United Kingdom.
More Information
Brexit
Feb 17, 2021
UK's status in European economic, trade and travel agreements.
More Information
Electric Mobility
Feb 16, 2021
This chart ranks the six largest markets in terms of electric passenger car sales in 2020.
More Information
Covid-19
Feb 15, 2021
This chart shows the actual and projected number of UK adults to have received the first dose of a Covid-19 vaccination.
More Information
Remittances
Feb 15, 2021
This chart shows overseas Filipinos' annual personal remittances (in billion U.S. dollars) and growth (in percent).
More Information
Boy Bands
Feb 12, 2021
This chart shows the boy bands with the highest combined net worth of their members (2020).
More Information
Economy
Feb 12, 2021
This chart shows the annual change in UK GDP from 1949 to 2020.
More Information
Hate Crime
Feb 11, 2021
This chart shows the number of antisemitic incidents reported in the United Kingdom from 2008 to 2020.
More Information
World Pulses Day
Feb 10, 2021
This chart shows the daily average consumption of pulses in selected countries in 2018 (in kcal per capita).
More Information
Covid-19 Pandemic
Feb 10, 2021
This chart shows Covid-19 cases in the United States involving emerging variants.
More Information
Money
Feb 9, 2021
This chart shows monthly transaction volumes of LINK ATMs in the UK from 2018 to 2020.
More Information
Germany
Feb 8, 2021
This chart shows the average temperature in Germany from December to February.
More Information
Covid Crisis
Feb 4, 2021
This chart shows new car registrations in the United Kingdom In January from 2011 to 2021.
More Information
Society
Feb 3, 2021
This chart compares levels of recorded crime before and during lockdown in the UK.
More Information
Covid-19 Pandemic
Feb 2, 2021
This chart shows Israeli study results of people vaccinated against Covid-19 and subsequent infections.
More Information
Covid-19 Outbreak
Feb 2, 2021
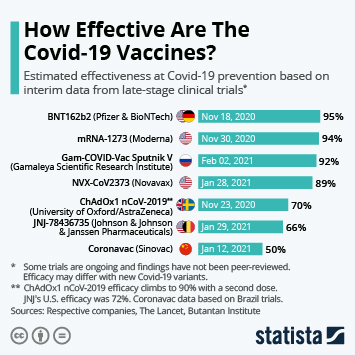
This chart shows the estimated effectiveness of Covid-19 vaccines based on interim data from late-stage clinical trials.
More Information
World Hijab Day
Feb 1, 2021
This chart shows the number of countries by continent which apply rules about women's religious head coverings (2018).
More Information
Economy
Jan 28, 2021
This chart shows the monthly change in the number of cars manufactured in the UK in 2020 compared to same period in 2019.
More Information
Pandemic
Jan 27, 2021
This chart shows the seven-day rolling average number of deaths in the UK within 28 days of a positive Covid-19 test.
More Information
Covid-19 Kuenssberg
Jan 27, 2021
This chart shows the number of confirmed deaths due to the coronavirus in the UK.
More Information
Dams
Jan 27, 2021
This chart shows the countries where the average age of large dams is highest (2020).
More Information
Covid-19 Outbreak
Jan 26, 2021
This chart shows the share who agree/disagree they would take a Covid-19 vaccine if it was available.
More Information
Society
Jan 26, 2021
This chart shows the increase in calls re. children and domestic violence to the UK charity NSPCC during the Covid-19 pandemic.
More Information
Foreign Direct Investment
Jan 25, 2021
This graphic shows foreign direct investment inflows to the U.S. and China since 2014.
More Information
Covid-19
Jan 21, 2021
This chart shows levels of happiness with their own 'emotional health' of young people in the UK.
More Information
Hospitals
Jan 20, 2021
This chart shows total hospital beds per 1,000 of the population in selected countries.
More Information
COVID-19
Jan 18, 2021
This chart shows the confirmed COVID-19 cases per one million population in selected countries.
More Information
Coronavirus
Jan 15, 2021
This chart shows the number of confirmed Covid-19 patients in UK hospitals.
More Information
Commuting
Jan 15, 2021
This chart shows the UK cities with the highest percentage of extra travel time due to congestion compared to uncongested conditions...
More Information
E-Commerce
Jan 15, 2021
This chart shows e-commerce as share of all retail commerce selected countries (2014-2020).
More Information
Aviation
Jan 15, 2021
This chart shows aircraft models with the highest estimated production figures in history*.
More Information
Travel
Jan 11, 2021
This chart shows the YOY change in traffic volumes of Heathrow airport in 2020.
More Information
Brexit
Jan 8, 2021
This chart shows what effect UK CFOs expect the points-based immigration system to have on long-term economic growth in the UK.
More Information
Economy
Jan 8, 2021
This chart shows UK CFOs biggest priorities for their business in 2021.
More Information
Earnings
Jan 6, 2021
This chart shows how long it takes FTSE 100 CEOs to outearn the average UK worker.
More Information
9
/
25
Contact
Get in touch with us. We are happy to help.
Do you still have questions?
Feel free to contact us anytime using our
contact form
or visit our
FAQ page
.
Your contact to the Infographics Newsroom
Felix Richter
Data Journalist
felix.richter@statista.com
+49 (40) 284 841 557