Skip to main content
Consumer Goods & FMCG
E-Commerce
Economy & Politics
Energy & Environment
Health, Pharma & Medtech
Internet
Media
Technology & Telecommunications
Transportation & Logistics
Travel, Tourism & Hospitality
View all industries
Global data volume growth
Global AI market size
Number of generative AI users worldwide
Global inflation rate
Retail e-commerce sales worldwide
Largest economies worldwide
Biggest social media platforms by users
Global EV market share by manufacturer
International tourist arrivals by world region
Global annual CO₂ emissions
Browse recent statistics
Artificial intelligence (AI) worldwide
TikTok
Nvidia
E-commerce worldwide
Global GDP
Instagram
Apparel market worldwide
Video gaming worldwide
Global renewable energy industry
Influencer marketing worldwide
Browse recent topics
Consumer Trends 2026
Artificial Intelligence: in-depth market analysis
E-commerce challenges
Global economy
TikTok
Luxury goods: in-depth market analysis
Electric vehicles: A global overview
Video gaming worldwide
Travel and tourism trends 2026
Battery recycling worldwide
Browse recent reports
Explore the tool
Explore Classic mode
Advertising & Media
eCommerce
Consumer
Finance
Global Indicators
Health
Industrial
Mobility
Technology
Explore Market Insights
eCommerce Insights
Research AI
Book a demo
All integrations
Developer docs
Explore Statista Connect
Research
Strategy & Consulting
Marketing
Media & PR
Explore AI assistants
Marketing
Research & Development
Strategy
Sales
Find the fact
Tell the story
Win the pitch
Understand the market
Develop your strategy
Academia
Agencies
Consultancies
Consumer goods
Finance
Tech
Research solutions
Strategy consulting
Communication services
Explore Statista+
Statista R
Statista Healthcare
About Statista
First steps & help center
Webinar & training hub
Success stories
Individuals & Small Teams
Businesses & Enterprises
Academia & Government
English
Deutsch
Daily Data
Infographics on the topic "uk"
Politics
May 4, 2022
This chart shows the issues which GB adults say are/would be very important when voting in May 2022 local elections.
More Information
Energy
May 2, 2022
This chart shows EU and U.S. imports of goods from Russia in 2021, by category (in billion U.S. dollars).
More Information
UK
Apr 29, 2022
This chart shows the weight of selected 'fatbergs' discovered in the UK.
More Information
Social Media
Apr 26, 2022
This chart shows the average time spent connected to social networks during a typical day in 2021 (hh:mm).
More Information
Populism
Apr 22, 2022
This chart shows the national election success of right-wing populist parties in selected countries in Europe.
More Information
Unicorns
Apr 20, 2022
This chart shows the number of privately-held, up-and-coming companies with a valuation of $1 billion or more, per country (as of March...
More Information
Employment Trends
Apr 20, 2022
This chart shows how employees want greater flexibility in their work schedules.
More Information
Partygate
Apr 13, 2022
This chart shows the share of the UK public that want Boris Johnson to step down from office in light of 'Partygate'.
More Information
Internet
Apr 6, 2022
This chart shows the share of parents in the UK saying their child has a social media profile in 2021, by age.
More Information
Europe
Apr 1, 2022
This chart shows the average net public support in France, Germany, Spain and Italy for candidate countries and Ukraine joining the...
More Information
Survey
Mar 28, 2022
This chart shows the results of a survey into vacation habits and activities in 2022.
More Information
FT1000
Mar 25, 2022
This chart shows the companies in Europe with the largest revenue compound annual growth rates (CAGR) from 2017 to 2020.
More Information
UK
Mar 23, 2022
This chart shows the countries which have gained independence from the United Kingdom/Great Britain.
More Information
Mobility
Mar 22, 2022
This chart tracks the average retail price of petrol in the UK.
More Information
Mobility
Mar 21, 2022
This chart shows the share of the total retail price of one litre of petrol in the UK, by component in March 2022.
More Information
Cryptocurrency
Mar 18, 2022
This chart shows countries/regional economies where cryptocurrencies are banned or regulated (as of Nov 2021).
More Information
Internet Control
Mar 16, 2022
This chart shows the number of government requests per half year for content to be removed from Google, by country.
More Information
Inheritance
Mar 11, 2022
This chart show the cumulative expected wealth transfers until 2030, by would region and wealth tier (in billion U.S. dollars).
More Information
Covid-19
Mar 11, 2022
This chart shows the global 7-day-rolling average of newly confirmed Covid-19 cases from 2020 to 2022.
More Information
Billionaires
Mar 10, 2022
This chart shows billionaires' wealth as a share of GDP in selected countries
More Information
European Gas Imports
Mar 8, 2022
This chart shows the main gas exporting countries in 2020, by type of export (in billion cubic meters).
More Information
Russian Billionaires
Mar 4, 2022
This chart shows selected Russian billionaires' net worth losses since Feb 23 2022.
More Information
Sanctions against Russia
Mar 3, 2022
This chart shows the valuation of the Russian ruble against the U.S. dollar.
More Information
Russia's Reserve
Feb 28, 2022
This chart shows the largest holders of Russian central bank foreign currency and gold reserves, by geographical distribution.
More Information
Import & Export
Feb 25, 2022
This chart shows the estimated change in Russia's GDP due to Western sanctions per sector.
More Information
Energy
Feb 24, 2022
This chart shows the share of gas supply from Russia in selected European countries (2020 or latest available).
More Information
Energy
Feb 15, 2022
This chart shows the cumulative EBIT of major UK energy firms from 2016 to 2020.
More Information
E-Commerce
Feb 15, 2022
This chart shows the e-commerce brands with the highest revenue in Europe in 2020.
More Information
Intellectual Property
Feb 10, 2022
This chart shows the share of women inventors among applicants for international patents in selected countries (2021).
More Information
Society
Feb 9, 2022
This chart shows the countries where belief in a "Covid myth" conspiracy is most widespread.
More Information
Energy
Feb 3, 2022
This chart shows major Russian-European natural gas pipelines and theoretical capacities (in billion cubic meters per annum).
More Information
Food consumption habits
Feb 3, 2022
This chart shows the share of respondents with selected views on breakfast.
More Information
Then&Now
Feb 2, 2022
This chart shows the development of monthly visits to the website for the game Wordle.
More Information
Cryptocurrency
Feb 2, 2022
This chart shows the index value of global cryptocurrency adoption per country (as of July 2021).
More Information
Economy
Jan 31, 2022
This chart shows the increase in general government gross debt in selected European countries (end of Q4 2019 to end of Q3 2021).
More Information
Grocery Shopping
Jan 31, 2022
This chart shows the most important purchase criteria of grocery shoppers in the U.S.
More Information
Holidays
Jan 27, 2022
This chart shows statutory minimum paid leave and public holidays in 2020 in selected countries.
More Information
Gambling
Jan 27, 2022
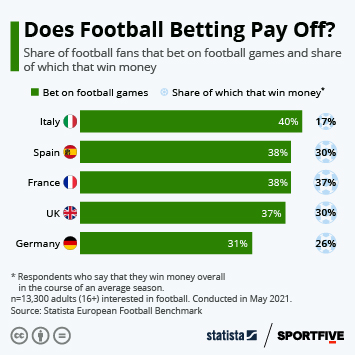
This chart shows the share of football fans in selected countries that place bets on matches, and how many of them say they make money...
More Information
FMCG
Jan 26, 2022
This chart shows the favourite snack foods of UK adults.
More Information
Wordle
Jan 24, 2022
This chart shows the share of U.S. adults who play online/mobile games, by age group.
More Information
Trust In Government
Jan 19, 2022
This chart shows the share trusting the government and change from 2020 to 2021.
More Information
Covid-19 Vaccines
Jan 18, 2022
This chart shows the share of the population in selected countries which has received a coronavirus vaccine booster shot (as of Jan...
More Information
Education
Jan 17, 2022
This chart shows the cities ranked as the best destinations for international university students in 2022.
More Information
UK
Jan 13, 2022
This chart shows the share of Conservative and Leave voters that approve or disapprove of Boris Johnson's job as prime minister in...
More Information
Media
Jan 13, 2022
This chart shows the most important revenue streams in journalism.
More Information
Coronavirus vaccines
Jan 13, 2022
More Information
Life
Jan 11, 2022
This chart shows the most popular New Year's resolutions for 2022.
More Information
Gross Domestic Product
Jan 7, 2022
This chart shows the GDP change in selected OECD countries between Q4 2019 and Q3 2021.
More Information
Exploration of Antarctica in the 20th century
Jan 7, 2022
This chart shows key facts about the "Heroic Age of Antarctic Exploration".
More Information
Internet of Things
Dec 22, 2021
This chart shows the approximate household penetration of smart home security products worldwide.
More Information
Politics
Dec 20, 2021
This chart shows the turnout for Hong Kong legislative elections from 1998 to 2021.
More Information
Society
Dec 9, 2021
This chart shows the average level of happiness in the UK from 2015 to 2021.
More Information
Social Media
Dec 1, 2021
This chart shows the highest acquisition prices for companies bought by Meta.
More Information
Coronavirus pandemic
Nov 30, 2021
This chart shows the general issues seen as most pressing during the pandemic.
More Information
Crime
Nov 24, 2021
This chart shows the Share of women aged 18-74 who experienced abuse before the age of 16 in England and Wales, by type.
More Information
Leadership during the coronavirus pandemic
Nov 24, 2021
This chart shows the countries exhibiting good leadership skills during the coronavirus pandemic.
More Information
Retail
Nov 24, 2021
This chart shows the results of a UK price tracking analysis for products advertised as 'Black Friday deals' in 2020.
More Information
UK
Nov 23, 2021
This chart shows the stimated number of migrants arriving in England via small boat channel crossings in 2020 and 2021.
More Information
UK
Nov 23, 2021
This chart shows the approval rating of Boris Johnson.
More Information
World Toilet Day
Nov 19, 2021
Share of people by country without access to at least basic sanitation services in 2020.
More Information
Misspelled brand names
Nov 19, 2021
This chart shows the average number of times the following brands are misspelled in online searches per month.
More Information
Budget 2021
Nov 19, 2021
This chart shows UK public sector net borrowing as a share of GDP since 1900.
More Information
Then & Now
Nov 17, 2021
This chart shows the percentage of Americans reporting sleeping six hours or less per night in 1942 and 2013.
More Information
Payment Methods For Online Purchases
Nov 10, 2021
This chart shows the preferred payment methods for online purchases in selected countries.
More Information
Cybersecurity
Nov 9, 2021
This chart shows the number of publicized ransomware attacks worldwide by sector.
More Information
UK Politics
Nov 9, 2021
This chart shows the share of GB adults that say Boris Johnson is competent or incompetent.
More Information
Sport
Nov 8, 2021
This chart shows the share of UK sports fans that follow US sports in 2021, by league
More Information
U.S. Sports
Nov 5, 2021
This chart shows the share of respondents who said they followed the following U.S. sports leagues (2021).
More Information
Climate
Nov 3, 2021
This chart shows the carbon pricing policies in selected countries in EUR per tonne of CO2 in 2021.
More Information
Trade
Oct 29, 2021
This chart compares the sizes of the EEZ surface are in European waters and fishing volumes.
More Information
Society
Oct 29, 2021
This chart shows daylight times in London before and after the clocks go back on 31 October 2021.
More Information
Payment Service Usage
Oct 28, 2021
This chart shows the "buy now, pay later" prevalence in select countries.
More Information
Economy
Oct 27, 2021
This chart shows the UK general government gross debt as a share of GDP since 1980/81.
More Information
Journalism Market
Oct 27, 2021
This chart shows the favored platforms for local topics according to Reuters Institute.
More Information
Society
Oct 26, 2021
This chart compares the most popular baby names given in England and Wales in 1996 and 2020.
More Information
Laptops
Oct 22, 2021
This chart shows the share of U.S. laptop owners who own a device from the following brands.
More Information
COVID-19 Lockdowns
Oct 21, 2021
This chart shows the areas with the longest cumulative pandemic lockdowns.
More Information
Art Auctions
Oct 19, 2021
This chart shows the most expensive Banksy artworks sold at auction.
More Information
United Kingdom
Oct 18, 2021
This chart shows the most commonly given names to babies born in 2020 in England and Wales.
More Information
Consumer Markets
Oct 18, 2021
This chart shows the fastest-growing consumer markets in the world by growth of the consumer class between 2020 and 2030.
More Information
InFact
Oct 15, 2021
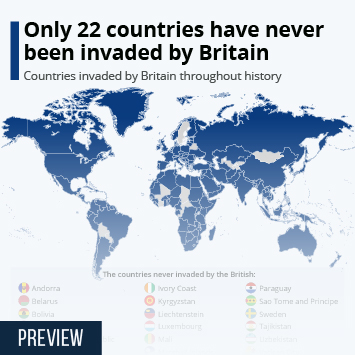
This chart shows all the countries invaded by Britain throughout history.
More Information
Society
Oct 14, 2021
This chart shows the total fertility rate of women in England and Wales from 1938 to 2020.
More Information
Trade
Oct 13, 2021
This chart shows the share of GB adults that reported experiencing difficulties buying certain goods in the UK in autumn 2021.
More Information
Health
Oct 11, 2021
This chart gives a breakdown of the people reporting Long Covid symptoms in the UK in 2021.
More Information
Digital Advertising
Oct 8, 2021
This chart shows the advertisement awareness on social media platforms.
More Information
Misconduct Investigations
Oct 7, 2021
This chart shows the share of companies where illegal and unethical behavior occurred/which lost more than €100,000 because of it in...
More Information
Nobel Prize in Literature
Oct 7, 2021
The chart shows the number of Literature Nobel Prize awarded by country.
More Information
Pandora Papers
Oct 4, 2021
This chart shows the countries with the most politicians included in the Pandora Papers release.
More Information
Pandora Papers
Oct 4, 2021
This chart shows the size of selected major data leaks.
More Information
Statista Global Consumer Survey
Oct 1, 2021
This chart shows the drinks that the most people in the UK drink regularly in 2021.
More Information
7
/
25
Contact
Get in touch with us. We are happy to help.
Do you still have questions?
Feel free to contact us anytime using our
contact form
or visit our
FAQ page
.
Your contact to the Infographics Newsroom
Felix Richter
Data Journalist
felix.richter@statista.com
+49 (40) 284 841 557