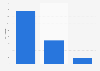
In 2021, the expenditure on television advertising of the furnishings category in Malaysia remained nearly unchanged at around 3.02 million U.S. dollars. Nevertheless, 2021 still represents a peak in the advertising spending in Malaysia.
Furnishings advertising spending on television in Malaysia from 2019 to 2021 (in million U.S. dollars)
Basic Account
Get to know the platform
You only have access to basic statistics.
This statistic is not included in your account.
Starter Account
The ideal entry-level account for individual users
- Instant access to 1m statistics
- Download in XLS, PDF & PNG format
- Detailed references
$199 USD / Month *
Professional Account
Full access
Business Solutions including all features.
* Prices do not include sales tax.
Other statistics that may interest you Statistics on
About the industry
10
- Premium Statistic Canada TV advertising revenue 2003-2022
- Premium Statistic Canada: TV advertising revenue 2003-2021, by source
- Premium Statistic Largest B2B TV advertisers in the UK 2022
- Premium Statistic Television advertising expenditure in Kazakhstan 2017-Q3 2023
- Premium Statistic TV ad revenue growth in Germany 2018-2027
- Premium Statistic TV advertising revenue in the United Kingdom (UK) 2013-2022, by source
- Premium Statistic TV advertising spending worldwide from 2000-2024, by region
- Premium Statistic Upfront TV ad spend in the U.S. 2019-2025
- Premium Statistic Linear TV ad spend in the U.S. 2019-2026
- Premium Statistic TV net advertising spending in the Netherlands 2012-2021
About the region
10
- Premium Statistic Media split in Malaysia 2015
- Premium Statistic Consumer trust in different types of advertising in Malaysia in Q2 2013
- Premium Statistic Share of advertising spending Malaysia 2022, by media type
- Premium Statistic YoY change in advertising expenditure Malaysia 2023, by media type
- Premium Statistic Advertising expenditure value in Malaysia 2015-2022
- Premium Statistic Share of total advertising expenditure on newspapers Malaysia 2013-2022
- Premium Statistic Television advertising market growth Malaysia 2012-2018
- Premium Statistic Television advertising market share Malaysia 2012-2018
- Premium Statistic Television advertising market size Malaysia 2012-2018
- Premium Statistic How media portrayals impacted the perception of aging Malaysia 2018
Other regions
10
- Premium Statistic Leading websites in the homeware sector in the UK 2023, by share of voice
- Premium Statistic Share of advertising market in Australia 2016 and 2021 by platform
- Premium Statistic Leading furniture retailers ranked by turnover in Europe 2020
- Basic Statistic Leading furniture and home furnishing retailers in Canada 2011
- Basic Statistic Panama: furniture types market share 2007-2018
- Premium Statistic TV advertising spending in Hong Kong 2012-2021
- Premium Statistic Ranking of furniture companies in Denmark 2018, by turnover
- Premium Statistic Share furniture and fixtures manufacturing value added GDP Philippines 2009-2018
- Premium Statistic Post and telecom brands' ad expenditure share in China H1 2019, by medium
- Premium Statistic Spot and non-spot broadcast ad revenue forecasted in the Netherlands 2014-2023
Further related statistics
7
- IKEA: net income worldwide 2009-2023
- Furniture shopping: Consumers' delivery preferences in the United Kingdom (UK) 2013
- Breakdown of U.S. online ad revenue 2023, by format
- Pfizer's ad spending 2006-2023
- Sponsorship spending in North America 2007-2018
- Sponsorship spending worldwide 2007-2018
- Magazine publishing revenue in Central & Eastern Europe 2009-2016, by B2B and B2C
Further Content: You might find this interesting as well
Statistics
- IKEA: net income worldwide 2009-2023
- Furniture shopping: Consumers' delivery preferences in the United Kingdom (UK) 2013
- Breakdown of U.S. online ad revenue 2023, by format
- Pfizer's ad spending 2006-2023
- Sponsorship spending in North America 2007-2018
- Sponsorship spending worldwide 2007-2018
- Magazine publishing revenue in Central & Eastern Europe 2009-2016, by B2B and B2C
Nielsen. (December 16, 2022). Furnishings advertising spending on television in Malaysia from 2019 to 2021 (in million U.S. dollars) [Graph]. In Statista. Retrieved April 26, 2024, from https://www.statista.com/statistics/1354419/furnishings-ad-spend-television-malaysia/
Nielsen. "Furnishings advertising spending on television in Malaysia from 2019 to 2021 (in million U.S. dollars)." Chart. December 16, 2022. Statista. Accessed April 26, 2024. https://www.statista.com/statistics/1354419/furnishings-ad-spend-television-malaysia/
Nielsen. (2022). Furnishings advertising spending on television in Malaysia from 2019 to 2021 (in million U.S. dollars). Statista. Statista Inc.. Accessed: April 26, 2024. https://www.statista.com/statistics/1354419/furnishings-ad-spend-television-malaysia/
Nielsen. "Furnishings Advertising Spending on Television in Malaysia from 2019 to 2021 (in Million U.S. Dollars)." Statista, Statista Inc., 16 Dec 2022, https://www.statista.com/statistics/1354419/furnishings-ad-spend-television-malaysia/
Nielsen, Furnishings advertising spending on television in Malaysia from 2019 to 2021 (in million U.S. dollars) Statista, https://www.statista.com/statistics/1354419/furnishings-ad-spend-television-malaysia/ (last visited April 26, 2024)
Furnishings advertising spending on television in Malaysia from 2019 to 2021 (in million U.S. dollars) [Graph], Nielsen, December 16, 2022. [Online]. Available: https://www.statista.com/statistics/1354419/furnishings-ad-spend-television-malaysia/