


D. Tighe
Research expert covering consumer behavior, sporting goods retail, and the global toy industry.
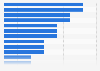
Get in touch with us nowThe statistic depicts the consumer spending in the United States related to the Super Bowl weekend from 2007 (Super Bowl XLI) to 2024 (Super Bowl LVIII). It is estimated that a total of more than 17 billion U.S. dollars will be spent by consumers in the United States on Super Bowl related purchases in 2023. These purchases include, for example, food and beverages, game-related merchandise, other apparel, decorations and televisions.
The Super Bowl, the annual NFL championship game, is one of the biggest sports events in the world. Super Bowl Sunday is somewhat of an unofficial holiday in the United States as the game is watched by millions of people every year. Due to its popularity and high TV ratings, the Super Bowl broadcast is a very attractive place for TV advertisements. In fact, the Super Bowl brings in hundreds of millions of U.S. dollars in ad revenue every single year. An average 30-second ad-spot during the Super Bowl broadcast is also very expensive, costing approximately seven million U.S. dollars in 2023.
The estimated total Super Bowl related consumer spending was at 17.3 billion U.S. dollars in 2024, an increase of nearly a billion U.S. dollars compared to the previous year. In 2024, consumers in the United States are expected to shell out an average of just over 85 U.S. dollars on purchases related to the Super Bowl, mainly on food and beverages. Other products that were purchased by consumers include team apparel/accessories, decorations, televisions and furniture. Part of this consumer spending also includes wagering money on the game. In 2023, about 11 million U.S. dollars was won on Super Bowl-related bets at casinos in the state of Nevada alone. This amounted to a winning percentage of about seven and a half percent.
* For commercial use only
Basic Account
Starter Account
The statistic on this page is a Premium Statistic and is included in this account.
Professional Account
1 All prices do not include sales tax. The account requires an annual contract and will renew after one year to the regular list price.
NFL overview
History & records
Tickets & attendance
TV & streaming
Commercials & halftime show
Consumer spending & opinion
Gambling & betting
Further related statistics
* For commercial use only
Basic Account
Starter Account
The statistic on this page is a Premium Statistic and is included in this account.
Professional Account
1 All prices do not include sales tax. The account requires an annual contract and will renew after one year to the regular list price.


