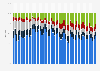
The statistic presents the share of interactive tablet ads in the United States in 2012 and 2013, by type of interactive features used. From January to September in 2012, 46 percent of the ads had the feature "tap to interact".
Share of tablet ads with interactive features in the United States in 2012 and 2013, by type
Characteristic
Jan-Sept 2012
Jan-Sept 2013
-
-
-
-
-
-
-
-
-
-
-
-
-
-
-
Exclusive Premium Statistic
To access all Premium Statistics, you need a paid Statista Account
Profit from the additional features of your individual account
Currently, you are using a shared account. To use individual functions (e.g., mark statistics as favourites, set
statistic alerts) please log in with your personal account.
If you are an admin, please authenticate by logging in again.
Learn more about how Statista can support your business.
Kantar. (February 14, 2014). Share of tablet ads with interactive features in the United States in 2012 and 2013, by type [Graph]. In Statista. Retrieved July 27, 2024, from https://www.statista.com/statistics/321377/tablet-ads-interactive-features-type-usa/
Kantar. "Share of tablet ads with interactive features in the United States in 2012 and 2013, by type." Chart. February 14, 2014. Statista. Accessed July 27, 2024. https://www.statista.com/statistics/321377/tablet-ads-interactive-features-type-usa/
Kantar. (2014). Share of tablet ads with interactive features in the United States in 2012 and 2013, by type. Statista. Statista Inc.. Accessed: July 27, 2024. https://www.statista.com/statistics/321377/tablet-ads-interactive-features-type-usa/
Kantar. "Share of Tablet Ads with Interactive Features in The United States in 2012 and 2013, by Type." Statista, Statista Inc., 14 Feb 2014, https://www.statista.com/statistics/321377/tablet-ads-interactive-features-type-usa/
Kantar, Share of tablet ads with interactive features in the United States in 2012 and 2013, by type Statista, https://www.statista.com/statistics/321377/tablet-ads-interactive-features-type-usa/ (last visited July 27, 2024)
Share of tablet ads with interactive features in the United States in 2012 and 2013, by type [Graph], Kantar, February 14, 2014. [Online]. Available: https://www.statista.com/statistics/321377/tablet-ads-interactive-features-type-usa/