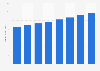
This statistic presents the projection of the average retail price point per segment of textile clothing and accessories in Russia for the year 2013, in Russian rubels. The luxury and premium price market showed the highest average retail price point, accumulating to 21,000 Russian rubels.
Projection of the average retail price points per segment of textile clothing and accessories in Russia for 2013, (in Russian rubles)
Loading statistic...
Basic Account
Get to know the platform
You only have access to basic statistics.
Starter Account
The ideal entry-level account for individual users
- Instant access to 1m statistics
- Download in XLS, PDF & PNG format
- Detailed references
$149 USD / Month *
Professional Account
Full access
Business Solutions including all features.
* Prices do not include sales tax.
Other statistics that may interest you Statistics on
About the industry
10
- Basic Statistic Clothing market: projected share of main 6 retail channels 2013
- Premium Statistic Share of clothing and accessory companies worldwide in 2018, by price segment
- Premium Statistic Breakdown of the global clothing and footwear market in 2019, by price segment
- Basic Statistic Import: value apparel and clothing accessories furskin UK 2011-2022
- Basic Statistic Export: value of apparel and clothing accessories made of furskin UK 2011-2022
- Basic Statistic Export: quantity apparel and clothing accessories furskin in the UK 2011-2022
- Basic Statistic Net sales share of Capri Holdings worldwide in 2023, by segment
- Basic Statistic Net sales of Capri Holdings worldwide in 2023, by segment
- Premium Statistic Clothing and footwear retail sales volume index in Great Britain 2011-2022
- Basic Statistic Gildan's gross profit worldwide from 2016 to 2022
About the region
10
- Premium Statistic IT market share in Russia 2021, by segment
- Premium Statistic IT market size in Russia 2013-2021
- Premium Statistic Russia: monthly value of fur clothing & apparel imports 2017-2018
- Premium Statistic Leading fashion online stores in Russia 2022, by revenue
- Premium Statistic Ranking of fashion items' online stores in Russia 2022, by order count
- Premium Statistic E-commerce revenue in Russia 2022, by segment
- Basic Statistic Rubber clothing and accessories import value in Russia 2011-2021
- Premium Statistic Domestic apparel market size in units in Russia 2017-2021
- Premium Statistic Home textiles sales in Russia 2020, by category
- Premium Statistic Textile manufacturing employees in Russia 2000-2020
Selected statistics
9
- Premium Statistic Footwear retail sales volume trend in Great Britain (UK) 2008-2022
- Basic Statistic Puma Group's market capitalization worldwide 1993-2022
- Basic Statistic Adidas Group's global net sales from 2002 to 2022, by product category
- Basic Statistic Hugo Boss - EBITDA 2005-2022
- Premium Statistic Number of Hugo Boss stores worldwide in 2022, by region
- Basic Statistic Number of Nike stores globally 2009-2023
- Basic Statistic Number of Hugo Boss stores worldwide in 2020, by store type
- Premium Statistic Alpine ski bindings and boots retail sales in the U.S. 2010-2016
- Premium Statistic U.S. snow sports stores snowboard boots retail inventory 2008/09-2012/13
Other regions
10
- Premium Statistic Forecast bioplastic production capacity worldwide 2026, by market segment
- Premium Statistic Quarterly retail sales of men's clothing in Canada 2012-2021
- Premium Statistic Annual revenue of clothing, footwear, and accessories retail Australia 2004-2022
- Premium Statistic Motorcycle sales in Italy by cylinder capacity 2019-2020
- Premium Statistic Distribution of the pharmaceutical market in China
- Premium Statistic Revenues from workwear, sportswear and other clothing in Germany 2006-2014
- Premium Statistic Home textiles market size in Latin America 2013-2020, by category
- Premium Statistic Home textiles market size in Asia-Pacific 2013-2020, by category
- Premium Statistic Home textiles market size in the Middle East & Africa 2013-2020, by category
- Premium Statistic Japan's home textiles market size 2013-2020, by category
Related statistics
10
- Premium Statistic Watches & jewelry: retail sales volume index in Russia 2000-2020
- Premium Statistic Perfumes & soaps: retail sales volume index in Russia 2000-2020
- Premium Statistic Outerwear's share of retail trade turnover in Russia 2000-2020
- Premium Statistic Value of the luxury fashion market in Russia 2014-2017
- Premium Statistic Fashion Market: Structure by price segment Russia 2014-2016
- Basic Statistic Import value of clothing accessories in Russia 2011-2022
- Premium Statistic Non-food retail trade turnover in Russia 2010-2022
- Premium Statistic Export value of knitted or crocheted clothing accessories in Russia 2011-2022
- Basic Statistic Import value of knitted or crocheted clothing accessories in Russia 2011-2022
- Premium Statistic Wholesale trade turnover in Russia 2000-2022
Further related statistics
10
- Revenue of the cosmetic & beauty industry in the U.S. 2002-2022
- 2010 global chemical market value by region
- Accessories segment sales of Puma worldwide from 1993 to 2022
- Sales of Johnson & Johnson 2006-2022 by region
- UEFA revenue 2005-2022, by stream
- Barnes & Noble sales 2012-2019, by commerce segment
- CBS Corporation's cable network revenue 2008-2018
- Most used HVAC brands in the U.S. 2018
- Most used lighting brands in the U.S. 2018
- BASF's revenue in the Oil & Gas segment 2007-2017
Further Content: You might find this interesting as well
Statistics
- Revenue of the cosmetic & beauty industry in the U.S. 2002-2022
- 2010 global chemical market value by region
- Accessories segment sales of Puma worldwide from 1993 to 2022
- Sales of Johnson & Johnson 2006-2022 by region
- UEFA revenue 2005-2022, by stream
- Barnes & Noble sales 2012-2019, by commerce segment
- CBS Corporation's cable network revenue 2008-2018
- Most used HVAC brands in the U.S. 2018
- Most used lighting brands in the U.S. 2018
- BASF's revenue in the Oil & Gas segment 2007-2017
EFTEC, & Igedo. (December 13, 2016). Projection of the average retail price points per segment of textile clothing and accessories in Russia for 2013, (in Russian rubles) [Graph]. In Statista. Retrieved November 30, 2023, from https://www.statista.com/statistics/650150/clothing-market-projection-average-retail-price-points-by-segment-russia-2013/
EFTEC, und Igedo. "Projection of the average retail price points per segment of textile clothing and accessories in Russia for 2013, (in Russian rubles)." Chart. December 13, 2016. Statista. Accessed November 30, 2023. https://www.statista.com/statistics/650150/clothing-market-projection-average-retail-price-points-by-segment-russia-2013/
EFTEC, Igedo. (2016). Projection of the average retail price points per segment of textile clothing and accessories in Russia for 2013, (in Russian rubles). Statista. Statista Inc.. Accessed: November 30, 2023. https://www.statista.com/statistics/650150/clothing-market-projection-average-retail-price-points-by-segment-russia-2013/
EFTEC, and Igedo. "Projection of The Average Retail Price Points per Segment of Textile Clothing and Accessories in Russia for 2013, (in Russian Rubles)." Statista, Statista Inc., 13 Dec 2016, https://www.statista.com/statistics/650150/clothing-market-projection-average-retail-price-points-by-segment-russia-2013/
EFTEC & Igedo, Projection of the average retail price points per segment of textile clothing and accessories in Russia for 2013, (in Russian rubles) Statista, https://www.statista.com/statistics/650150/clothing-market-projection-average-retail-price-points-by-segment-russia-2013/ (last visited November 30, 2023)
Projection of the average retail price points per segment of textile clothing and accessories in Russia for 2013, (in Russian rubles) [Graph], EFTEC, & Igedo, December 13, 2016. [Online]. Available: https://www.statista.com/statistics/650150/clothing-market-projection-average-retail-price-points-by-segment-russia-2013/