Skip to main content
Consumer Goods & FMCG
E-Commerce
Economy & Politics
Energy & Environment
Health, Pharma & Medtech
Internet
Media
Technology & Telecommunications
Transportation & Logistics
Travel, Tourism & Hospitality
View all industries
Global data volume growth
Global AI market size
Number of generative AI users worldwide
Global inflation rate
Retail e-commerce sales worldwide
Largest economies worldwide
Biggest social media platforms by users
Global EV market share by manufacturer
International tourist arrivals by world region
Global annual CO₂ emissions
Browse recent statistics
Artificial intelligence (AI) worldwide
TikTok
Nvidia
E-commerce worldwide
Global GDP
Instagram
Apparel market worldwide
Video gaming worldwide
Global renewable energy industry
Influencer marketing worldwide
Browse recent topics
Consumer Trends 2026
Artificial Intelligence: in-depth market analysis
E-commerce challenges
Global economy
TikTok
Luxury goods: in-depth market analysis
Electric vehicles: A global overview
Video gaming worldwide
Travel and tourism trends 2026
Battery recycling worldwide
Browse recent reports
Explore the tool
Explore Classic mode
Advertising & Media
eCommerce
Consumer
Finance
Global Indicators
Health
Industrial
Mobility
Technology
Explore Market Insights
eCommerce Insights
Research AI
Book a demo
All integrations
Developer docs
Explore Statista Connect
Research
Strategy & Consulting
Marketing
Media & PR
Explore AI assistants
Marketing
Research & Development
Strategy
Sales
Find the fact
Tell the story
Win the pitch
Understand the market
Develop your strategy
Academia
Agencies
Consultancies
Consumer goods
Finance
Tech
Research solutions
Strategy consulting
Communication services
Explore Statista+
Statista R
Statista Healthcare
About Statista
First steps & help center
Webinar & training hub
Success stories
Individuals & Small Teams
Businesses & Enterprises
Academia & Government
English
Deutsch
Daily Data
Global stories vividly visualized
Energy
Jan 5, 2018
This chart shows weekly U.S. field production of crude oil from 1983 to 2017.
More Information
Tax Reform
Jan 5, 2018
This chart shows how U.S. companies plan to use foreign earnings that they could bring back to the U.S. at a reduced tax rate under...
More Information
Tesla
Jan 4, 2018
This chart shows how many cars Tesla delivered annually since 2012.
More Information
European Union
Jan 4, 2018
This chart shows the share of the population who cannot afford to keep their home adequately warm in 2016.
More Information
Employment
Jan 4, 2018
This chart shows projected real wage growth in selected OECD countries in 2018.
More Information
Marijuana
Jan 4, 2018
This chart shows the projected growth of U.S. recreational and medical marijuana sales.
More Information
Iran Protests
Jan 3, 2018
This chart shows the annual jump in the price of basic goods in Iran.
More Information
New Year
Jan 3, 2018
This chart shows responses to a survey about 2017 and 2018 in Great Britain.
More Information
Sport
Jan 2, 2018
This chart shows the defenders bought by Premier League clubs for the largest transfer fees.
More Information
Mobile Devices
Jan 2, 2018
This chart breaks down new device activations in the week leading up to Christmas 2017 by manufacturer.
More Information
U.S. Military In Europe
Jan 2, 2018
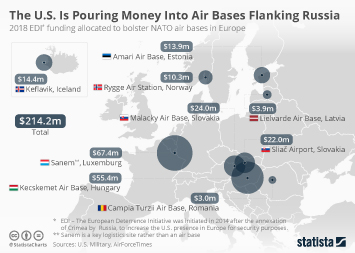
This chart shows 2018 EDI funding allocated to bolster NATO air bases in Europe.
More Information
United States
Jan 2, 2018
This chart shows the most common new year's resolutions in the U.S. in 2018.
More Information
Foreign assistance
Jan 2, 2018
This chart shows the amount of foreign assistance spent by the United States in Pakistan from 2013 to 2018.
More Information
Santa Claus
Dec 22, 2017
This chart shows the facts behind Santa Claus...if he really exists....
More Information
Happy Holidays
Dec 22, 2017
More Information
Video Streaming
Dec 21, 2017
This chart illustrates the rise of video streaming adoption in the United States.
More Information
Holiday Music
Dec 21, 2017
This chart shows whether the myth that holiday music is just about repeating the same old classics is actually true.
More Information
Foreign Aid
Dec 21, 2017
This chart shows U.S. foreign aid so selected countries in the Middle East 2016 (in billion U.S. dollars)
More Information
Used Cars
Dec 21, 2017
This chart shows car brands in the U.S. with the lowest average repair cost in 2017.
More Information
Books
Dec 20, 2017
This chart shows the top publishing markets for new book titles in 2014-2015.
More Information
FIlm & TV
Dec 20, 2017
This infographic shows a selection of TV & film locations you can visit in the UK & Ireland.
More Information
Tax Reform Bill
Dec 20, 2017
This chart shows the share of respondents who think the following about the tax reform bill 2017
More Information
Out of Bounds
Dec 20, 2017
This chart shows a comparison of price developments during the tulip mania in 1637 and the current bitcoin bonanza of 2017
More Information
Alcohol Abuse
Dec 20, 2017
This chart shows the share of adults who reported binge/chronic drinking in 2017.
More Information
Donald Trump
Dec 19, 2017
This chart shows the number of lies/falsehoods told by Trump/Obama since inauguration day.
More Information
Smart Speakers
Dec 19, 2017
This chart shows worldwide smart speaker shipments in Q3 2017.
More Information
Digital photography
Dec 19, 2017
This chart shows the most popular cameras used by Flickr users in 2017.
More Information
Electronic Waste
Dec 19, 2017
This chart shows the potential value and volume of raw materials in e-waste worldwide 2016
More Information
ISIS
Dec 19, 2017
This chart shows the top manufacturing countries of ISIS weaponry documented in Syria and Iraq.
More Information
European Union
Dec 19, 2017
This chart shows the share of Europeans who have travelled at least once outside the EU.
More Information
Mobile Shopping
Dec 18, 2017
This chart shows the percentage of U.S. e-commerce spending across different categories that was spent on mobile devices in Q3 2017.
More Information
Bitcoin Futures
Dec 18, 2017
This chart shows the 24-hour trading volume in Bitcoin as of December 2017, by cryptocurrency market (in million USD).
More Information
Brexit
Dec 18, 2017
This infographic shows British residents in favour of remaining in or leaving the EU (in percent)
More Information
UK Film Industry
Dec 15, 2017
This chart shows the gross value added of film, video and television companies in the UK.
More Information
Uranium
Dec 15, 2017
This infographic shows a ranking of countries with the biggest production volume of uranium in 2016 (in kilotons)
More Information
Firearms
Dec 15, 2017
This chart shows the share of violent deaths attributable to guns or other means in 2016.
More Information
Irish Defence Forces
Dec 15, 2017
This chart shows male and female personnel in the Irish Defence Forces in 2017.
More Information
Star Wars
Dec 15, 2017
This chart shows the projected annual insurance cost of selected Star Wars spaceships and vehicles.
More Information
Germany
Dec 15, 2017
This chart shows the cities with the most car-sharing vehicles per 1,000 inhabitants.
More Information
Ad Spend
Dec 14, 2017
This infographic shows growth in ad spend by region, 2016 to 2o17 (in percent)
More Information
Brands
Dec 14, 2017
This chart shows top reasons for consumers to shun brands and most disliked behaviour (in percent)
More Information
Sleep
Dec 14, 2017
This chart shows the sleep deprivation rate in selected major U.S. cities in 2017.
More Information
Alcohol
Dec 14, 2017
This chart shows the biggest importers of champagne from France in 2016.
More Information
Music Streaming
Dec 14, 2017
This chart shows the number of worldwide paying subscribers of music streaming services.
More Information
Myanmar
Dec 14, 2017
This chart shows total deaths/type of violent death experienced by the Rohingya population*
More Information
Belt and Road
Dec 14, 2017
This chart shows the value of China's M&A activity in 'Belt and Road' countries from 2005 to 2016, by sector.
More Information
E-Waste
Dec 14, 2017
This chart ranks the top 10 countries generating the highest amount of electronic waste in 2016.
More Information
Debt
Dec 14, 2017
This chart shows the share of residents with debt in collections in 2016.
More Information
North Koreans In The U.S.
Dec 13, 2017
This chart shows the U.S. states where North Korean refugees have settled (Jan 2006-Aug 2015)
More Information
Smart Home
Dec 13, 2017
This chart shows how much more likely households equipped with a smart speaker are to own other smart home devices.
More Information
Christmas in the US
Dec 13, 2017
This chart shows fun facts about Christmas in the United States with selected insights from Statista's Holiday Season & Spending Survey...
More Information
Alabama Election
Dec 13, 2017
This chart shows a demographic breakdown of votes cast in the 2017 U.S. Senate special election in Alabama.
More Information
Marijuana
Dec 13, 2017
This chart shows responses to the question "Should the use of marijuana be made legal or not?"
More Information
Special Immigrant Visas
Dec 13, 2017
This chart shows Afghan and Iraqi citizens entering the U.S. under special immigrant visa programs.
More Information
Royal Navy
Dec 13, 2017
This chart shows facts and figures about the Royal Navy's biggest-ever warship.
More Information
Online privacy
Dec 12, 2017
This chart ranks companies tracking online behavior by the reach of their tracking scripts.
More Information
Corruption
Dec 12, 2017
This chart shows the share of EU-28 respondents considering corruption widespread in 2017.
More Information
Out of Bounds
Dec 12, 2017
This infographic shows Americans and Chinese who are religious, not religious or atheist (in percent)
More Information
Politics
Dec 12, 2017
This chart shows how the religion of a political candidate in the U.S. can affect their success.
More Information
Apple to acquire Shazam
Dec 11, 2017
This chart illustrates the user growth of music recognition app Shazam since 2008.
More Information
Brexit trade talks
Dec 11, 2017
This chart shows the import sources of the United Kingdom (UK) at the end of 2016, by import value (in million GBP).
More Information
Germany
Dec 8, 2017
This chart shows words of the year as chosen by the GfdS.
More Information
Etsy vs. Amazon
Dec 8, 2017
This chart shows the quarterly revenue of online marketplace Etsy.
More Information
Germany
Dec 8, 2017
This chart shows Deutsche Bahn network changes with new schedule on 10.12.2017.
More Information
Mueller Investigation
Dec 8, 2017
This chart shows the public's views on Robert Mueller's investigation into the Trump administration's alleged ties to Russia.
More Information
North Korea
Dec 8, 2017
This chart shows countries that violated international sanctions on North Korea (Mar 2014-Sep 2017).
More Information
Advertising
Dec 7, 2017
This chart shows the percentage of global advertising revenues that goes to Google and Facebook.
More Information
Gaming
Dec 7, 2017
This chart shows the video games released in 2017 with the highest Metacritic score.
More Information
Best Employers
Dec 7, 2017
This chart shows the average employee rating on Glassdoor of the best-rated companies in the UK.
More Information
Germany
Dec 7, 2017
This chart shows the share of Germans who get their boots filled by Nicholas and attitude to Knecht Ruprecht.
More Information
Madagascar
Dec 7, 2017
This chart presents facts related to the infectious disease 'plague'.
More Information
Alcohol
Dec 7, 2017
This chart shows countries with the highest consumption of alcohol per capita a year (pure alcohol in litres)
More Information
Best Employers
Dec 7, 2017
This chart shows the average employee rating on Glassdoor of the best-rated companies in the U.S.
More Information
Quality Of Life
Dec 7, 2017
This chart shows responses to the question: "is life in our country better or worse today than it was 50 years ago?"
More Information
North Korea
Dec 6, 2017
This chart shows the annual number of "ghost ships" found in Japan from 2011 to 2017.
More Information
Music streaming
Dec 6, 2017
This chart shows the most-streamed songs on Spotify from 2013 to 2018.
More Information
Football World Cup 2018
Dec 6, 2017
This chart shows the market value of the Football World Cup 2018 teams
More Information
2018 World Cup
Dec 6, 2017
This chart shows the teams that qualified for the World Cup by share of players at foreign clubs.
More Information
Marketing
Dec 6, 2017
This chart shows the share of respondents who want to invest more of their budget in following marketing areas
More Information
Beer Consumption
Dec 6, 2017
This chart shows on-trade/off-trade beer consumption in selected European countries in 2016.
More Information
Firearms
Dec 6, 2017
This chart shows the total number of NICS background checks in the U.S. (2000-2016).
More Information
Ad Spend
Dec 5, 2017
This chart shows the worldwide digital and TV ad spending (in billion U.S. dollars)
More Information
Brexit
Dec 5, 2017
This chart shows Twitter activity by Russian bots in the run-up to the Brexit vote.
More Information
Instagram
Dec 5, 2017
This chart shows the number of business profiles and active advertisers on Instagram.
More Information
Football
Dec 5, 2017
This chart shows the estimated transfer value of English under-21 football players.
More Information
Northen Ireland
Dec 5, 2017
This chart shows the share of votes for remain by constituency in Northern Ireland.
More Information
Languages
Dec 5, 2017
This chart shows the share of students learning two or more foreign languages in 2015.
More Information
Out of Bounds
Dec 5, 2017
This chart shows the average yearly number of deaths by selfie and shark attacks worldwide
More Information
Snack Attack
Dec 5, 2017
This chart shows the sales value of snacks in the United States in 2017, by category (in billion U.S. dollars)
More Information
Cycling
Dec 5, 2017
This chart shows the cyclist fatality rate per million people in the U.S. in 2015.
More Information
119
/
161
Contact
Get in touch with us. We are happy to help.
Do you still have questions?
Feel free to contact us anytime using our
contact form
or visit our
FAQ page
.
Your contact to the Infographics Newsroom
Felix Richter
Data Journalist
felix.richter@statista.com
+49 (40) 284 841 557