Skip to main content
Consumer Goods & FMCG
E-Commerce
Economy & Politics
Energy & Environment
Health, Pharma & Medtech
Internet
Media
Technology & Telecommunications
Transportation & Logistics
Travel, Tourism & Hospitality
View all industries
Global data volume growth
Global AI market size
Number of generative AI users worldwide
Global inflation rate
Retail e-commerce sales worldwide
Largest economies worldwide
Biggest social media platforms by users
Global EV market share by manufacturer
International tourist arrivals by world region
Global annual CO₂ emissions
Browse recent statistics
Artificial intelligence (AI) worldwide
TikTok
Nvidia
E-commerce worldwide
Global GDP
Instagram
Apparel market worldwide
Video gaming worldwide
Global renewable energy industry
Influencer marketing worldwide
Browse recent topics
Consumer Trends 2026
Artificial Intelligence: in-depth market analysis
E-commerce challenges
Global economy
TikTok
Luxury goods: in-depth market analysis
Electric vehicles: A global overview
Video gaming worldwide
Travel and tourism trends 2026
Battery recycling worldwide
Browse recent reports
Explore the tool
Explore Classic mode
Advertising & Media
eCommerce
Consumer
Finance
Global Indicators
Health
Industrial
Mobility
Technology
Explore Market Insights
eCommerce Insights
Research AI
Book a demo
All integrations
Developer docs
Explore Statista Connect
Research
Strategy & Consulting
Marketing
Media & PR
Explore AI assistants
Marketing
Research & Development
Strategy
Sales
Find the fact
Tell the story
Win the pitch
Understand the market
Develop your strategy
Academia
Agencies
Consultancies
Consumer goods
Finance
Tech
Research solutions
Strategy consulting
Communication services
Explore Statista+
Statista R
Statista Healthcare
About Statista
First steps & help center
Webinar & training hub
Success stories
Individuals & Small Teams
Businesses & Enterprises
Academia & Government
English
Deutsch
Daily Data
Global stories vividly visualized
UK
Dec 4, 2017
This chart shows whether who people in the UK trust to tell the truth.
More Information
Crime
Dec 4, 2017
This chart shows the number of journalists killed between 2012 and 2016, by country.
More Information
Energy Costs
Dec 4, 2017
This chart shows average monthly energy costs by state in 2017.
More Information
Military & Geopolitics
Dec 4, 2017
This chart shows armies of selected countries by active military personnel in 2017
More Information
Refugees & Migration
Dec 4, 2017
This chart shows refugee resettlement ceilings and the number of refugees admitted, by fiscal year
More Information
Politics
Dec 1, 2017
This chart shows the subject of the last completed degree of the President or Prime Minister in European countries.
More Information
Holiday Spending on Decor and Furnishings in 2017
Dec 1, 2017
This chart shows US spending on year-end holiday decor and furnishings in 2017 based on a Statista survey with 1.025 respondents.
More Information
New figures
Dec 1, 2017
This chart shows UK net migration from June 2014 to June 2017.
More Information
Travel
Dec 1, 2017
More Information
Political Systems
Dec 1, 2017
This chart shows attitudes towards direct democracy in selected countries in 2017
More Information
Beer Consumption
Dec 1, 2017
This chart shows litres of beer consumed per capita in 2016.
More Information
Macroeconomics
Dec 1, 2017
Average federal tax revenue and average annual real GDP per capita growth rate in U.S.
More Information
International Series - Farsi
Dec 1, 2017
Part of Statista's International Series (Farsi): The importance of the nuclear deal for Iranian tourism.
More Information
Automation
Dec 1, 2017
This chart shows the potential number of displaced jobs due to automation by 2030.
More Information
Smartphone Market
Nov 30, 2017
This chart shows the market share of the five largest smartphone vendors in the world, based on unit sales to end users.
More Information
Movie Franchises
Nov 30, 2017
This chart shows box office revenue of movie franchises in North America.
More Information
Prince Harry's Engagement
Nov 30, 2017
This chart shows the share of people feeling the following about Harry's engagement to Meghan Markle.
More Information
Beer
Nov 30, 2017
This chart shows the number of active breweries in European countries in 2016.
More Information
Employment
Nov 30, 2017
This chart shows the share of work hours in 2016 with potential for automation by 2030 in selected countries.
More Information
Tax
Nov 30, 2017
This chart shows tax as a percentage of GDP in 2016 (selected OECD countries).
More Information
Middle East
Nov 29, 2017
This chart shows the number of U.S. troops in Syria and Iraq on September 30, 2017.
More Information
Coup Attempts
Nov 29, 2017
This chart shows coup d'état and coup attempts around the world since 2011 (up to November 2017).
More Information
Financial Costs of Brexit
Nov 29, 2017
This chart shows payments requested and offered in connection with the UK leaving the EU (in billion euros)
More Information
Professional Sports
Nov 29, 2017
This chart shows the number of sports teams owned by billionaires by world region and type of sport
More Information
Soccer
Nov 29, 2017
This chart shows the total annual salary of the top-7 women's soccer leagues in 2017.
More Information
Billionaires
Nov 28, 2017
This chart ranks the 10 richest individuals worldwide by their net worth in November 2017.
More Information
UK stress tests
Nov 28, 2017
This chart shows the most cited sources of risk to the UK financial system in 2017 H2.
More Information
Net Neutrality
Nov 28, 2017
This chart shows the results of a survey on net neutrality in the United States.
More Information
World Cup
Nov 28, 2017
This chart shows the teams that qualified for the World Cup by share of players born abroad.
More Information
New Survey
Nov 28, 2017
This chart shows the results of a survey about the companies that make the most positive impact on U.S. communities in 2017.
More Information
Tattoo Removal
Nov 28, 2017
Number of tattoo removal procedures worldwide in 2016.
More Information
Taxes
Nov 28, 2017
This chart displays the top 10 OECD countries with the highest tax-to-GDP ratio in 2016.
More Information
United Kingdom
Nov 27, 2017
This chart shows the verage percentage difference in hourly earnings between men and women in the UK in 2017.
More Information
Influencers
Nov 27, 2017
This chart shows the food-related Instagram accounts with the most followers in 2017.
More Information
Ireland
Nov 27, 2017
This chart shows key facts about the border in Ireland.
More Information
Thanksgiving Travel Rush
Nov 27, 2017
This chart shows the total departing passengers at U.S. airports in Thanksgiving week in 2017.
More Information
Eurozone
Nov 24, 2017
This chart shows the average amount of cash in wallet in 2017 (eurozone).
More Information
Graduates
Nov 24, 2017
Percentage of graduates in the UK population from 2002 to 2017
More Information
Michelin Stars
Nov 24, 2017
This chart shows countries by the number of 3-star restaurants in November 2017.
More Information
War Crimes
Nov 23, 2017
This chart shows the number of people indicted on Yugoslav war crimes charges.
More Information
Monarchy
Nov 23, 2017
This chart shows the annual contribution of the monarchy to the UK economy in 2017.
More Information
Thanksgiving
Nov 23, 2017
This chart shows sales of selected items the week before and week of Thanksgiving.
More Information
Perishable Goods
Nov 23, 2017
This chart shows the category share of bulk meat sales at delis in the United States in 2017
More Information
Broadband
Nov 23, 2017
This chart shows the average cost of a broadband plan per month (U.S. dollars).
More Information
Influencers
Nov 22, 2017
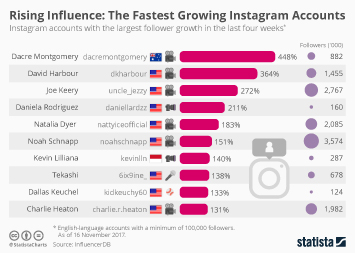
This chart shows the Instagram accounts with the largest follower growth in the last four weeks.
More Information
Most valuable companies
Nov 22, 2017
This chart ranks the most valuable companies in the world in terms of market capitalization in November 2017.
More Information
International Series - Swedish
Nov 22, 2017
Part of Statista's International Series: Uppgång av antal elbilar i Sverige
More Information
Data breaches
Nov 22, 2017
This chart shows how many user accounts were compromised in selected hacking attacks.
More Information
Thanksgiving
Nov 22, 2017
This chart shows the share agreeing the following is most likely to spur a Thanksgiving argument.
More Information
UN Tribunal in The Hague
Nov 22, 2017
This chart shows key figures on the trial of Ratko Mladic before the UN Tribunal for the Former Yugoslavia
More Information
UN Tribunal
Nov 22, 2017
This infographic shows key figures of the International Tribunal for the Former Yugoslavia (ICTY) in The Hague
More Information
Trophy Hunting
Nov 22, 2017
This chart shows the top countries of origin of animals imported as trophies to the U.S. from 2005 to 2014.
More Information
UK Budget 2017
Nov 21, 2017
This chart shows the views of British adults on the issue of tax spending and public services funding in 2017.
More Information
AT&T - Time Warner
Nov 21, 2017
This chart provides an overview of the brands and assets that the proposed $85 billion merger between AT&T and Time Warner would bring...
More Information
PISA
Nov 21, 2017
This chart shows the countries with the highest mean scores of 15-year-olds in 'collaborative problem solving'.
More Information
Geoblocking
Nov 21, 2017
This chart shows geoblocking on e-commerce websites in the EU by sector in 2016
More Information
Afghanistan
Nov 21, 2017
This chart shows cropland for opium poppy and production potential of opium and in Afghanistan
More Information
Troops Overseas
Nov 21, 2017
This chart shows the share of military forces operationally deployed in 2016.
More Information
Online Retail
Nov 21, 2017
This chart shows holiday season online retail sales (in billion U.S. dollars)
More Information
Germany
Nov 20, 2017
This infographic shows respondents who want the following after coalition building collapsed, by party affiliation (in %)
More Information
Retail
Nov 20, 2017
This chart shows the average planned spend on Christmas gifts in the U.S. from 1999 to 2017.
More Information
Graduates
Nov 20, 2017
This chart shows global universities producing students with the highest employability in 2017.
More Information
Out of Bounds
Nov 20, 2017
This chart shows obesity and smoking rates among U.S. adults, 2000 compared to 2014
More Information
New Study
Nov 17, 2017
This chart shows the countries with the highest defense spending as a share of GDP.
More Information
Black Friday
Nov 17, 2017
This chart shows the peak shopping hours in a store on Black Friday 2017.
More Information
Greenhouse Gas Emissions
Nov 17, 2017
This chart provides a breakdown of transportation-related greenhouse gas emissions in the United States in 2015.
More Information
UK Politics
Nov 17, 2017
This chart shows the total claims made by UK MPs for security assistance from 2010 to 2017.
More Information
Reddit
Nov 17, 2017
This chart shows the number of subreddits, i.e. forums dedicated to a particular topic, available on Reddit.
More Information
2018 World Cup
Nov 17, 2017
This chart shows the teams that qualified for the 2018 World Cup and current FIFA ranking.
More Information
International Series - Italian
Nov 17, 2017
Part of Statista's International Series: Le aziende dove si lavora meglio in Italia.
More Information
Anti-Muslim Assaults
Nov 17, 2017
This chart shows the number of anti-Muslim assaults in the U.S. reported to the FBI.
More Information
Manufacturing Costs of the iPhone
Nov 16, 2017
This chart compares the iPhone X's estimated manufacturing costs with those of its predecessors.
More Information
Expatriates
Nov 16, 2017
This chart shows the top and bottom cities by quality of life for expatriates in 2017.
More Information
Education
Nov 16, 2017
This chart shows the UK universities producing students with the highest employability in 2017.
More Information
Price of Football
Nov 16, 2017
This chart shows the cost for a fan in the stadium per goal scored by the home team in the English Premier League.
More Information
Conservation
Nov 15, 2017
This chart shows the share of natural/mixed sites with a conservation outlook of 'significant concern' or 'critical' in 2017.
More Information
Healthcare
Nov 15, 2017
This chart shows the share of NHS nurses saying the following with regard to their job/financial situation.
More Information
Marriage
Nov 15, 2017
This chart shows an age distribution of young children that got married in the U.S. from 2000 to 2015.
More Information
Smuggling
Nov 15, 2017
This chart shows smuggled cigarettes as a share of total cigeratte consumption in U.S. states in 2015.
More Information
Defense
Nov 15, 2017
This chart shows the top ten armed forces in the EU by number of active military personnel (in 1,000)
More Information
Internet Freedom
Nov 14, 2017
This chart shows the prevalence of manipulation tactics on social media in 65 countries.
More Information
Shale
Nov 14, 2017
Tgus cgart shiws historical and projected U.S. oil and gas production (million barrels oil equivalent per day).
More Information
Advertising
Nov 14, 2017
This chart shows the sales contribution of advertising campaign elements (in percent)
More Information
Sport
Nov 14, 2017
This chart shows the number of times selected men's national soccer teams failed to qualify for the FIFA World Cup.
More Information
International Students
Nov 14, 2017
This chart shows the leading destinations for U.S. international students in 2015/16.
More Information
Sexual Harassment
Nov 13, 2017
This chart shows U.S. thoughts on sexual harassment in 2017.
More Information
Education
Nov 13, 2017
This chart is a country breakdown of the twenty best-rated universities in Europe.
More Information
Climate
Nov 13, 2017
This chart shows the countries with the highest average annual weather-related fatalities per 100,000 inhabitants from 1996 to 2016.
More Information
Internet Access
Nov 13, 2017
This chart shows the percentage of internet users in selected countries who access the web exclusively via mobile devices.
More Information
"Out of Bounds"
Nov 13, 2017
This chart shows the years that elapsed between the dismantlement of nuclear weapons programs & violent death of dictators
More Information
120
/
161
Contact
Get in touch with us. We are happy to help.
Do you still have questions?
Feel free to contact us anytime using our
contact form
or visit our
FAQ page
.
Your contact to the Infographics Newsroom
Felix Richter
Data Journalist
felix.richter@statista.com
+49 (40) 284 841 557