Skip to main content
Consumer Goods & FMCG
E-Commerce
Economy & Politics
Energy & Environment
Health, Pharma & Medtech
Internet
Media
Technology & Telecommunications
Transportation & Logistics
Travel, Tourism & Hospitality
View all industries
Global data volume growth
Global AI market size
Number of generative AI users worldwide
Global inflation rate
Retail e-commerce sales worldwide
Largest economies worldwide
Biggest social media platforms by users
Global EV market share by manufacturer
International tourist arrivals by world region
Global annual CO₂ emissions
Browse recent statistics
Artificial intelligence (AI) worldwide
TikTok
Nvidia
E-commerce worldwide
Global GDP
Instagram
Apparel market worldwide
Video gaming worldwide
Global renewable energy industry
Influencer marketing worldwide
Browse recent topics
Consumer Trends 2026
Artificial Intelligence: in-depth market analysis
E-commerce challenges
Global economy
TikTok
Luxury goods: in-depth market analysis
Electric vehicles: A global overview
Video gaming worldwide
Travel and tourism trends 2026
Battery recycling worldwide
Browse recent reports
Explore the tool
Explore Classic mode
Advertising & Media
eCommerce
Consumer
Finance
Global Indicators
Health
Industrial
Mobility
Technology
Explore Market Insights
eCommerce Insights
Research AI
Book a demo
All integrations
Developer docs
Explore Statista Connect
Research
Strategy & Consulting
Marketing
Media & PR
Explore AI assistants
Marketing
Research & Development
Strategy
Sales
Find the fact
Tell the story
Win the pitch
Understand the market
Develop your strategy
Academia
Agencies
Consultancies
Consumer goods
Finance
Tech
Research solutions
Strategy consulting
Communication services
Explore Statista+
Statista R
Statista Healthcare
About Statista
First steps & help center
Webinar & training hub
Success stories
Individuals & Small Teams
Businesses & Enterprises
Academia & Government
English
Deutsch
Daily Data
Global stories vividly visualized
Social Media
Feb 10, 2023
This chart shows the length of Donald Trump's social media ban by platform.
More Information
Account Sharing
Feb 10, 2023
This chart show how many streaming subscribers would be willing to pay extra for the ability to share their account legally.
More Information
Tech Investments
Feb 10, 2023
This video shows how a $1,000 investment in some of the largest tech companies on the planet at the beginning of 2010 has changed in...
More Information
Super Bowl
Feb 10, 2023
This chart shows retail sales increases for selected snack products in the week leading up to Super Bowl 2022.
More Information
Currency
Feb 10, 2023
This chart shows countries which feature women on their banknotes (as of February 2023).
More Information
Earthquakes
Feb 9, 2023
This chart shows the world's tectonic plates and positions of convergent (e.g. approaching) plate boundaries.
More Information
Google
Feb 9, 2023
This chart shows the market share of the world's largest search engines.
More Information
Real Wages
Feb 9, 2023
This chart shows average full-time real wages before tax in selected countries in 1990 and 2021 (in U.S. dollars/PPP).
More Information
NHS Crisis
Feb 8, 2023
This chart shows the share of people in the UK that are paying for private health insurance.
More Information
Turkey/Syria Earthquake
Feb 8, 2023
This chart shows the number of emergency, medical and rescue personnel sent to Turkey, by origin country/territory.
More Information
NHS strikes
Feb 8, 2023
This chart shows the percentage of forieign trained doctors in selected countries.
More Information
Basketball
Feb 8, 2023
This chart shows the all-time leading point scorers in the NBA since 1946.
More Information
NBA
Feb 8, 2023
This chart shows the points-per-game average for the NBA's all-time leading point scorers.
More Information
Artículo patrocinado por Booking.com
Feb 8, 2023
Esta infografía muestra las percepciones del sector hotelero europeo sobre el sector, por países.
More Information
Publication sponsorisée par Booking.com
Feb 8, 2023
Cette infographie montre le ressenti des hôteliers européens sur la conjoncture dans leur secteur d'activité, par pays.
More Information
Turkey-Syria earthquakes
Feb 7, 2023
This chart shows the earthquake and aftershocks recorded in Turkey and northern Syria between 6-7 February.
More Information
Health care
Feb 7, 2023
This chart shows per-capita health expenditure in selected countries in 2021.
More Information
China
Feb 6, 2023
This chart shows the share of the population who thinks that China is having a positive/negative effect on world affairs in 2022*
More Information
Grammy Awards
Feb 6, 2023
This chart shows the artists with the most Grammys from 1959 to 2023.
More Information
Chinese Balloon
Feb 6, 2023
This chart shows the approximate path of Chinese surveillance balloon across the United States and Canada between Jan. 28 and Feb....
More Information
OpenAI
Feb 6, 2023
This chart the number of companies working with OpenAI in different sectors.
More Information
Grammy Awards
Feb 6, 2023
This chart shows the individuals with the most Grammy nominations of all time.
More Information
Police violence
Feb 6, 2023
This chart shows the share of U.S. respondents who said police violence against the public was a serious problem in the U.S., by party.
More Information
Police Budgets
Feb 6, 2023
This chart shows the share of general fund expenditure on policing in selected U.S. cities, in the latest year available as of Feb....
More Information
Tech
Feb 3, 2023
This chart shows the forecast total addressable metaverse market, by scenario, from 2023 to 2030.
More Information
Sponsored post by Booking.com
Feb 3, 2023
This infographic shows the cities with the highest share of properties receiving a Booking.com Traveller Review Award 2023.
More Information
Transfer market
Feb 3, 2023
This video shows cumulative transfer spending of clubs from European football leagues since 2000.
More Information
Artificial Intelligence
Feb 1, 2023
This chart shows which areas of life consumers around the world expect to change the most due to the increased use of AI in the next...
More Information
Metals
Jan 31, 2023
This chart shows the countries with the largest cobalt mine production in 2021.
More Information
IMF
Jan 31, 2023
This chart shows the IMF's 2023 projections for the G7 members.
More Information
Indian Media
Jan 31, 2023
This chart shows ownership shares of TV Today Network and NDTV (as of Jan. 31, 2023).
More Information
Publication sponsorisée par Booking.com
Jan 31, 2023
Cette infographie montre les principaux défis auxquels sont confrontés les hôteliers européens en 2022.
More Information
Media
Jan 30, 2023
This chart shows forecast growth in global digital audio revenue, by segment, from 2018 to 2027.
More Information
Weather
Jan 30, 2023
This chart shows new all-time cold temperatures records in Asia, by location.
More Information
Professional Tennis
Jan 30, 2023
This chart shows the male tennis players with the most Grand Slam singles titles in the Open Era.
More Information
Freedom of movement
Jan 30, 2023
This chart shows the top and lowest scoring countries on the Africa Openness Index in 2022.
More Information
Sponsored post by Booking.com
Jan 27, 2023
This infographic shows the share of nights booked by international travelers on online travel platforms in Australia from 2019 to 2021.
More Information
Sponsored post by Booking.com
Jan 27, 2023
This infographic shows the GDP and job impacts attributable to online travel platforms in Australia from 2019 to 2021.
More Information
95th Academy Awards
Jan 26, 2023
This chart shows the Big Five Oscar nominations ad wins with participants who are Black, of Asian or of Latin American backgrounds.
More Information
Artificial Intelligence
Jan 26, 2023
This chart shows the number of active AI and machine learning patent families held by company.*
More Information
Demographics
Jan 26, 2023
This chart shows the validated age at time of death and place of birth of the oldest people to have lived.
More Information
Trade
Jan 25, 2023
This chart shows the top source country for imports in African countries in 2000 and 2020.
More Information
Music
Jan 25, 2023
This chart shows the share of respondents from selected countries who listen to the following musical genres in digital formats (in...
More Information
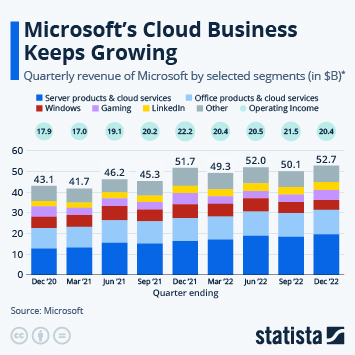
Microsoft
Jan 25, 2023
This chart shows the quarterly revenue of Microsoft by selected segments.
More Information
Winter sports
Jan 25, 2023
This chart shows the combined ticket sales of selected multi-sport winter games.
More Information
Medical marajuana
Jan 24, 2023
This chart shows the share of people in selected countries that would be open to taking medical cannabis for treatment.
More Information
gold
Jan 24, 2023
This chart shows the Latin American countries with the largest gold reserves.
More Information
Insurance
Jan 24, 2023
This chart shows the share of insured people in selected countries that use legal expenses insurance in selected countries.
More Information
Layoffs in the tech industry
Jan 24, 2023
This chart shows the estimated number of jobs cut in the largest layoffs by U.S. tech companies since 2020.
More Information
Smart Speakers
Jan 23, 2023
This chart shows the most popular smart speaker brands in the United States.
More Information
Arms Exports
Jan 23, 2023
This chart shows the number of Leopard 2 battle tanks exported from Germany (2000-2021).
More Information
Sponsored post by Booking.com
Jan 20, 2023
This graphic shows that online travel platforms make travel more affordable for Australian consumers.
More Information
Chinese New Year
Jan 20, 2023
Change in travel behavior during the Lunar New Year holiday period in China (2019 to 2023).
More Information
Minimum wage
Jan 20, 2023
This chart shows the minimum wage of different countries in Latin America.
More Information
Video Games
Jan 20, 2023
This chart shows the number of games approved in China per year.
More Information
Sponsored post by Booking.com
Jan 20, 2023
This graphic shows European hoteliers' sentiment toward their economic future.
More Information
Sponsored post by Booking.com
Jan 20, 2023
This graphic shows that online travel platforms generate additional bookings for Australian accommodations.
More Information
Megacities
Jan 19, 2023
This chart shows the forecast for the world's next megacities by 2050.
More Information
Population
Jan 19, 2023
This chart shows estimated the estimated population in India and China (2020-2100).
More Information
Megacities
Jan 19, 2023
This chart shows the forecast for megacities in Africa by 2050.
More Information
mobile data
Jan 19, 2023
This chart shows the cost of mobile data in different African countries.
More Information
Online Dating
Jan 18, 2023
This chart shows the penetration rate and revenue of dating apps and platforms in selected countries (2023 forecast).
More Information
China
Jan 17, 2023
This chart shows China's real GDP growth since 1980.
More Information
Coffee Day
Jan 17, 2023
This chart shows the share of U.S. coffee drinkers by level/frequency of coffee consumption.
More Information
Sponsored post by Booking.com
Jan 17, 2023
This infographic shows that share of travel accommodation sales in Europe, by location.
More Information
car rental
Jan 17, 2023
This chart shows the share of UK respondents that would use the following car rental companies again.
More Information
Artículo patrocinado por Booking.com
Jan 17, 2023
Esta infografía muestra los principales retos a los que se enfrentan los hoteleros europeos en 2022.
More Information
eVTOL
Jan 16, 2023
This chart shows the different kinds of investment car makers are putting into eVTOLs.
More Information
Cereals
Jan 16, 2023
This chart shows the share of selected cereal crops in primary cereal production in China, the U.S. and Brazil (in percent)-
More Information
Ozone Layer
Jan 16, 2023
This chart shows the global consumption of ozone-depleting chemicals (in tonnes of ozone-depleting potential/CO₂-equivalent).
More Information
Mining & Metals
Jan 13, 2023
This chart shows global rare earth reserves and production in 2021.
More Information
Climate Change
Jan 13, 2023
This chart shows global ocean surface temperatures from 1880 to 2022 as a divergence from the 20th century average.
More Information
Sponsored post by Booking.com
Jan 13, 2023
This infographic shows the cumulative GDP impact of online travel platforms in Europe from 2019 to 2021.
More Information
Sponsored post by Booking.com
Jan 13, 2023
This infographic shows the cumulative additional room nights generated by online travel platforms in Europe by country from 2019 to...
More Information
Urban Air Mobility
Jan 13, 2023
This chart shows the share of people in selected European urban centers that would try out an air taxi.
More Information
Delivery drones
Jan 13, 2023
This chart shows the share of people living in several urban centers that would try out a delivery drone.
More Information
Friday 13th
Jan 13, 2023
This chart shows the occurrence of Friday the 13th in the years 2020 to 2029.
More Information
Inflation
Jan 12, 2023
This chart shows the annual inflation rate in the United States (1990-2022).
More Information
Statista Global Consumer Survey
Jan 12, 2023
This chart shows the most common beverages U.S. adults said they consumed regularly in 2022*
More Information
Face Masks
Jan 12, 2023
This chart shows estimated global face mask unit sales and revenue.
More Information
Aviation
Jan 12, 2023
This chart shows the share of late arrivals by North American airlines (in percent of all flights).
More Information
Energy
Jan 11, 2023
This chart shows the change in natural gas consumption of EU countries, Aug-Nov 2022 vs. 2017-2021 average.
More Information
EVs
Jan 11, 2023
This chart shows projected BEV penetration rates for passenger vehicles in India, by vehicle class (in percent).
More Information
Energy
Jan 11, 2023
This chart shows the (forecast) distribution of global electricity generation, by technology in 2021 and 2027.
More Information
Shipping Industry
Jan 11, 2023
This chart shows selected countries on the Liner Shipping Connectivity Index 2021 (2004 max. result=100)
More Information
Assault Weapons
Jan 11, 2023
This chart shows U.S. states with/without a ban on assault weapons/high-capacity magazines (as of Jan 11, 2023).
More Information
Immigration
Jan 11, 2023
This chart shows the share of UK adults that would like to see an increase/decrease of migrants in the following professions.
More Information
Trusted Professions
Jan 11, 2023
This chart shows the share of U.S. respondents rating the honesty/ethical standards of the following professions as high/low.
More Information
Shipping
Jan 11, 2023
This chart shows the number of vessels with different countries of registration.
More Information
Environmental Regulations
Jan 10, 2023
This chart shows the most common type of stove in the U.S., by household (2020)
More Information
46
/
161
Contact
Get in touch with us. We are happy to help.
Do you still have questions?
Feel free to contact us anytime using our
contact form
or visit our
FAQ page
.
Your contact to the Infographics Newsroom
Felix Richter
Data Journalist
felix.richter@statista.com
+49 (40) 284 841 557