Skip to main content
Consumer Goods & FMCG
E-Commerce
Economy & Politics
Energy & Environment
Health, Pharma & Medtech
Internet
Media
Technology & Telecommunications
Transportation & Logistics
Travel, Tourism & Hospitality
View all industries
Global data volume growth
Global AI market size
Number of generative AI users worldwide
Global inflation rate
Retail e-commerce sales worldwide
Largest economies worldwide
Biggest social media platforms by users
Global EV market share by manufacturer
International tourist arrivals by world region
Global annual CO₂ emissions
Browse recent statistics
Artificial intelligence (AI) worldwide
TikTok
Nvidia
E-commerce worldwide
Global GDP
Instagram
Apparel market worldwide
Video gaming worldwide
Global renewable energy industry
Influencer marketing worldwide
Browse recent topics
Consumer Trends 2026
Artificial Intelligence: in-depth market analysis
E-commerce challenges
Global economy
TikTok
Luxury goods: in-depth market analysis
Electric vehicles: A global overview
Video gaming worldwide
Travel and tourism trends 2026
Battery recycling worldwide
Browse recent reports
Explore the tool
Explore Classic mode
Advertising & Media
eCommerce
Consumer
Finance
Global Indicators
Health
Industrial
Mobility
Technology
Explore Market Insights
eCommerce Insights
Research AI
Book a demo
All integrations
Developer docs
Explore Statista Connect
Research
Strategy & Consulting
Marketing
Media & PR
Explore AI assistants
Marketing
Research & Development
Strategy
Sales
Find the fact
Tell the story
Win the pitch
Understand the market
Develop your strategy
Academia
Agencies
Consultancies
Consumer goods
Finance
Tech
Research solutions
Strategy consulting
Communication services
Explore Statista+
Statista R
Statista Healthcare
About Statista
First steps & help center
Webinar & training hub
Success stories
Individuals & Small Teams
Businesses & Enterprises
Academia & Government
English
Deutsch
Daily Data
Global stories vividly visualized
Coronavirus
Feb 4, 2020
This chart shows coronavirus deaths in mainland China compared to the 2002-2003 SARS epidemic.
More Information
Airports
Feb 4, 2020
This chart shows the number of passengers in the Indian domestic air travel market (FY 2014/15- 2018-19).
More Information
Handedness
Feb 4, 2020
This chart shows the rate of left-handedness in selected countries.
More Information
Africa
Feb 4, 2020
This chart shows the size of GDP for select African countries as of 2019 (in billion U.S. dollars).
More Information
United Kingdom
Feb 4, 2020
This chart shows the share bothered by hearing a non-English conversation among foreigners.
More Information
War Deaths
Feb 4, 2020
This chart shows the estimated number of deaths in selected warzones since 9/11.
More Information
Ideology
Feb 3, 2020
This chart shows the percentage of registered voters on how they feel about capitalism and socialism between 2018 and 2020.
More Information
2020 Presidential Election
Feb 3, 2020
This chart shows the percent of immigrant populations in select U.S. counties, cities and states.
More Information
2020 Election
Feb 3, 2020
This chart shows polling averages for Iowa, New Hampshire and the U.S. ahead of the 2020 Democratic presidential primaries.
More Information
Asia
Feb 3, 2020
This chart shows the monthly number of visitors to Hong Kong in 2019.
More Information
Driving
Feb 3, 2020
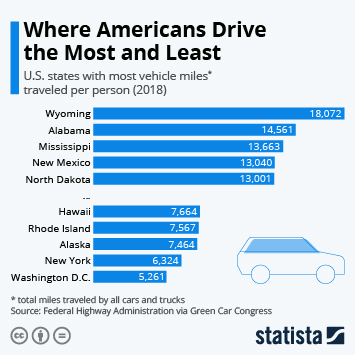
This chart shows the U.S. states with the most and the least vehicle miles traveled per resident in 2018.
More Information
Brexit
Feb 3, 2020
This chart shows the distribution of UK European Parliament seats by Member
More Information
2020 Election
Feb 3, 2020
This chart shows total donations for candidate committees in the 2020 presidential general election and primaries (as of Q4, 2019).
More Information
Social Media
Feb 3, 2020
This chart shows the share of Facebook MAUs that are thought to be duplicate or false accounts.
More Information
Amazon
Jan 31, 2020
Amazon's total market valuation between Jan. 2015 and Jan. 2020 (in billion U.S. dollars).
More Information
2020 Election
Jan 31, 2020
This chart shows the percentage of Democratic voters on how good a job primaries will be in selecting a general election candidate.
More Information
Recalls
Jan 31, 2020
This chart shows major food recalls in the U.S. in 2019 by reason for the recall.
More Information
Retirement
Jan 31, 2020
This chart shows the average length of retirement for men and women in selected OECD countries.
More Information
Brexit Day
Jan 31, 2020
This chart shows the United Kingdom's share of selected components of the European Union.
More Information
2020 Election
Jan 30, 2020
This chart shows the percentage of U.S. voters who feel a certain way about the 2020 presidential campaign.
More Information
Huawei
Jan 30, 2020
This chart shows countries that have banned Huawei products or are planning to do so (as of Aug 19, 2019).
More Information
Traditional Chinese Medicine
Jan 30, 2020
This chart shows the growth of the traditional Chinese medicine market.
More Information
Congestion
Jan 30, 2020
This chart shows hours of extra travel time due to traffic congestion in U.S. cities in 2019.
More Information
Q3 Results
Jan 30, 2020
This chart shows revenue and operating income of Microsoft in the segment 'Intelligent Cloud'.
More Information
Traffic Congestion
Jan 30, 2020
This chart shows the percentage of extra travel time due to congestion in 2019.
More Information
Childbirth
Jan 30, 2020
This chart shows the average hospital admission cost for a c-section/standard delivery in 2017.
More Information
Newspapers
Jan 29, 2020
This chart shows the number of daily newspapers owned by each media organization.
More Information
Google Rewards
Jan 29, 2020
This chart shows the total reward payouts by Google for finding software vulnerabilities each year (in million U.S. dollars).
More Information
2020 Election
Jan 29, 2020
This chart shows the 2020 Democratic primary candidates perceived as most honest.
More Information
Coronavirus
Jan 29, 2020
This chart shows countries/territories which have confirmed cases of the coronavirus.
More Information
Coronavirus
Jan 29, 2020
This chart shows coronavirus cases/deaths compared to the 2002-2003 SARS epidemic (mainland China).
More Information
Super Bowl
Jan 28, 2020
This chart shows the Super Bowl viewers in 2019 who've purchased the following alcoholic beverages in the past 30 days.
More Information
Middle East
Jan 28, 2020
This chart shows the populations of Israel and Palestine between 1960 and 2020, along with the average growth in the last 10 years.
More Information
Space
Jan 28, 2020
This chart shows the number of consecutive days in space for each NASA astronaut.
More Information
Afghanistan
Jan 28, 2020
This chart shows weapons released by the U.S. coalition over Afghanistan (2006-2019).
More Information
Europe
Jan 28, 2020
This chart shows the number of people aged 65+ per 100 people of working age in selected EU countries.
More Information
Meat Consumption
Jan 28, 2020
This chart shows whether Americans are eating more, less or the same amount of meat.
More Information
Female Genital Mutilation
Jan 28, 2020
This chart shows countries with bans on female genital mutilation in 2019.
More Information
Meat
Jan 27, 2020
This chart shows the percentage of Americans responding on reasons why they ate less meat in 2019, along with Americans' meat-eating...
More Information
Social Mobility
Jan 27, 2020
This chart shows the social mobility index scores of a given country, pulled from the Global Social Mobility Index 2020 of the World...
More Information
Tech Jobs
Jan 27, 2020
This chart shows the size of the total tech labor force in 2018 and relative growth between 2013-2018 in a given city.
More Information
Big Mac Index
Jan 27, 2020
This graph shows the price for a Big Mac in selected countries.
More Information
Grammys
Jan 27, 2020
This chart shows the youngest Grammy winners of all time (as of Jan 2020).
More Information
China
Jan 27, 2020
This chart shows the estimated revenue from arms sales and military services in 2017.
More Information
Library
Jan 24, 2020
This chart shows the number of times a person said they visited/attended each activity in the U.S. in 2019.
More Information
Cashless
Jan 24, 2020
This chart shows the number of non-cash transactions worldwide between 2016 and 2022 (in billions).
More Information
2020 Presidential Election
Jan 24, 2020
This chart shows how U.S. registered voters answered when asked, "Who would you support for the Democratic nomination for president?"
More Information
Portugal
Jan 24, 2020
This chart shows key developments since Portugal decriminalized drugs in 2001.
More Information
Netflix
Jan 24, 2020
This chart shows the number of Netflix memberships, by region.
More Information
Grand Slam Winners
Jan 24, 2020
This chart shows the youngest Tennis players at the time of their first Grand Slam title.
More Information
Netflix
Jan 24, 2020
This chart shows Netflix's cash spending on content since 2014.
More Information
Climate change
Jan 24, 2020
More Information
Impeachment
Jan 24, 2020
This chart shows poll averages of surveys asking Americans whether they support or oppose the impeachment of President Trump. (2019/20)
More Information
International Holocaust Remembrance Day
Jan 24, 2020
This chart U.S. public responses to the following questions about the Holocaust.
More Information
Capitalism
Jan 24, 2020
This chart shows the share agreeing "capitalism as it exists today does more harm than good in the world".
More Information
iPad
Jan 23, 2020
This chart shows revenue for the iPad as a share of Apple's total global revenue from 3rd quarter 2010 to 4th quarter 2019.
More Information
FIFA World Ranking
Jan 23, 2020
This chart shows the international ranking score for national soccer teams.
More Information
NBA
Jan 23, 2020
This chart highlights a few key stats from each NBA player's debut game.
More Information
Personal Savings in the U.S.
Jan 23, 2020
This chart shows the when U.S. adults were asked how they would pay for an emergency $1,000 bill. They said…
More Information
Democratic Primary
Jan 23, 2020
This chart shows the percentage of registered Democrats/Democratic-leaning independents who are most likely to support a given candidate.
More Information
Chinese New Year
Jan 23, 2020
This chart shows the number of airline passengers during Chinese New Year from 2014 to 2020.
More Information
Soccer Transfers
Jan 23, 2020
This chart shows global spending on soccer transfer fees by year (billion U.S. dollars).
More Information
Plant-based Burger
Jan 22, 2020
This chart shows the percent of U.S. adults who rated beef-based and plant-based burgers from 1 to 10.
More Information
Guns
Jan 22, 2020
This chart shows the rate of civilian gun ownership by country in terms of the number of firearms per 100 people.
More Information
Polarization
Jan 22, 2020
This chart shows the approval percentages of presidents by party in a given year.
More Information
Food Recalls
Jan 22, 2020
This chart shows the total number of food recalls in the U.S. from 2013 to 2018
More Information
Chinese New Year
Jan 22, 2020
This chart shows the estimated number of people traveling to the following events (millions).
More Information
Trump Administration
Jan 21, 2020
This chart shows the percent of U.S. adults who think President Donald Trump should be removed from office.
More Information
Trump Administration
Jan 21, 2020
This chart shows the percent of U.S. adults who support additional witnesses at Senate impeachment trial for President Donald Trump.
More Information
Homicides
Jan 21, 2020
This chart shows the number of homicide investigations in Mexico per year and rate per 100,000 inhabitants from 1997 to 2018/19.
More Information
Employment
Jan 21, 2020
This chart shows the industries/sectors in the UK with the highest median graduate starting salaries in 2020.
More Information
UK Politics
Jan 21, 2020
This chart shows a simulated Labour leadership contest according to Labour members' order of preference in January 2020.
More Information
World Economic Forum
Jan 21, 2020
This chart shows the global risks considered the most likely in the next ten years, by category.
More Information
Data Breaches
Jan 21, 2020
This chart shows personal data breaches notified per EEA jurisdiction.
More Information
Recession
Jan 21, 2020
This chart shows the share of U.S. survey respondents worrying a major recession is just around the corner (2018-2019).
More Information
Research & Development
Jan 21, 2020
This chart shows gross domestic expenditures on R&D.
More Information
Employment
Jan 20, 2020
This chart shows the industries/sectors in the UK with the most planned graduate vacancies in 2020.
More Information
Endorsements
Jan 20, 2020
This chart shows the 2020 Democratic primary candidates with most valuable endorsements.
More Information
Brexit
Jan 20, 2020
This chart shows cumulative UK real GDP losses due to Brexit by year.
More Information
World Economic Forum
Jan 20, 2020
This chart shows the countries with the most attendees at the World Economic Forum 2020.
More Information
Economic Outlook
Jan 20, 2020
This chart compares global GDP growth forecasts by major international organizations.
More Information
Brexit
Jan 20, 2020
This chart shows the forecast cost of Brexit compared to the UK's EU budget contributions.
More Information
Royal Family
Jan 20, 2020
This chart shows the share of headlines about Kate & Meghan that were positive/negative (May '18-Jan '19).
More Information
Australia
Jan 17, 2020
This chart shows daily average PM2.5 pollution levels in Melbourne and other selected cities in Jan 2020.
More Information
Netflix
Jan 17, 2020
This chart shows the percentage of U.S. respondents who paid for digital video content from the following companies in the last 12...
More Information
Demographics
Jan 17, 2020
This chart shows the number of death registrations in the United Kingdom from 1974 to 2018.
More Information
Alphabet
Jan 17, 2020
This chart shows Google market capitalization since 2004.
More Information
Music
Jan 17, 2020
This chart shows the artists with the most on-demand audio/video streams in the U.S. from 2010 to 2019.
More Information
Malaria
Jan 16, 2020
This chart shows the estimated number of malaria cases in Africa per year (in millions).
More Information
Australia
Jan 16, 2020
This chart shows the average annual rainfall in Australia from 2009 to 2019 in millimeters.
More Information
84
/
161
Contact
Get in touch with us. We are happy to help.
Do you still have questions?
Feel free to contact us anytime using our
contact form
or visit our
FAQ page
.
Your contact to the Infographics Newsroom
Felix Richter
Data Journalist
felix.richter@statista.com
+49 (40) 284 841 557