Skip to main content
Consumer Goods & FMCG
E-Commerce
Economy & Politics
Energy & Environment
Health, Pharma & Medtech
Internet
Media
Technology & Telecommunications
Transportation & Logistics
Travel, Tourism & Hospitality
View all industries
Global data volume growth
Global AI market size
Number of generative AI users worldwide
Global inflation rate
Retail e-commerce sales worldwide
Largest economies worldwide
Biggest social media platforms by users
Global EV market share by manufacturer
International tourist arrivals by world region
Global annual CO₂ emissions
Browse recent statistics
Artificial intelligence (AI) worldwide
TikTok
Nvidia
E-commerce worldwide
Global GDP
Instagram
Apparel market worldwide
Video gaming worldwide
Global renewable energy industry
Influencer marketing worldwide
Browse recent topics
Consumer Trends 2026
Artificial Intelligence: in-depth market analysis
E-commerce challenges
Global economy
TikTok
Luxury goods: in-depth market analysis
Electric vehicles: A global overview
Video gaming worldwide
Travel and tourism trends 2026
Battery recycling worldwide
Browse recent reports
Explore the tool
Explore Classic mode
Advertising & Media
eCommerce
Consumer
Finance
Global Indicators
Health
Industrial
Mobility
Technology
Explore Market Insights
eCommerce Insights
Research AI
Book a demo
All integrations
Developer docs
Explore Statista Connect
Research
Strategy & Consulting
Marketing
Media & PR
Explore AI assistants
Marketing
Research & Development
Strategy
Sales
Find the fact
Tell the story
Win the pitch
Understand the market
Develop your strategy
Academia
Agencies
Consultancies
Consumer goods
Finance
Tech
Research solutions
Strategy consulting
Communication services
Explore Statista+
Statista R
Statista Healthcare
About Statista
First steps & help center
Webinar & training hub
Success stories
Individuals & Small Teams
Businesses & Enterprises
Academia & Government
English
Deutsch
Daily Data
Global stories vividly visualized
2020 Election
Feb 20, 2020
This chart shows the minutes spoken in the February 19 televised Democratic debate.
More Information
2020 Election
Feb 20, 2020
This chart shows cumulative minutes spoken during past DNC debates among candidates for the Democratic party nomination in the 2020...
More Information
Economic impact of COVID-19
Feb 20, 2020
This chart shows the estimated impact of the COVID-19 outbreak on global tech shipments in Q1 2020.
More Information
Environment
Feb 20, 2020
This chart shows environmental taxes as a share of total taxes & social contributions in 2018.
More Information
Corruption
Feb 20, 2020
This chart shows the number of federal corruption convictions per 10,000 inhabitants.
More Information
Travel & Tourism
Feb 19, 2020
This chart shows the number of tourists who visited New Orleans and how much money they spent.
More Information
2020 Election
Feb 19, 2020
This chart shows the percentage of registered voters who say they've seen an advertisement for each candidate.
More Information
Trump Administration
Feb 19, 2020
This chart shows the U.S. presidents who gave the most pardons while in office.
More Information
Climate Change
Feb 19, 2020
This chart shows the overall temperature change in degrees Fahrenheit measured in each state between 1970-2018.
More Information
Holden Axed
Feb 19, 2020
This chart shows vehicles sold by the car brand Holden in Australia between 2013 and 2019.
More Information
Brexit
Feb 19, 2020
This chart shows the percentage of workers in the UK who came from EU countries in 2017.
More Information
Hong Kong
Feb 18, 2020
The percentage of people in Hong Kong who believe their local economy is getting better or worse.
More Information
Boy Scouts
Feb 18, 2020
This chart shows the number of members for each Boy Scouts program between 2012 and 2018.
More Information
Germany
Feb 18, 2020
This chart shows the estimated number of visitors to the Rose Monday parade.
More Information
Coronavirus
Feb 18, 2020
This chart shows the COVID-19 fatality rate by age.
More Information
Coronavirus
Feb 18, 2020
This chart shows COVID-19 case severity (as of February 11, 2020)
More Information
2020 Election
Feb 17, 2020
This chart shows money spent by 2020 presidential and presidential primary candidates on digital ads.
More Information
Emissions
Feb 17, 2020
This chart shows the per-capita CO2 emissions by U.S. state in 2018.
More Information
Power Dynamics
Feb 17, 2020
This chart shows survey responses in selected countries towards to whether the U.S. or China are seen as the world's leading economic...
More Information
Germany
Feb 17, 2020
This chart shows the foreign population as a share of the total population in German federal states (Nov 2018).
More Information
German Economy
Feb 14, 2020
This chart shows the percentage growth of industrial production in Germany in 2019.
More Information
Public Policy
Feb 14, 2020
This chart shows the percentage of U.S. adults by age group who believe a given issue should be the top priority for the Trump Administration...
More Information
Flu
Feb 14, 2020
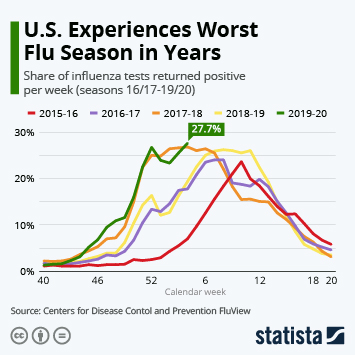
This chart shows the development of U.S. flu seasons from 2015/16 to 2019/20 by the share of samples tested positive per calendar week.
More Information
Survey
Feb 14, 2020
This chart shows which housework tasks are most often solely done by men or by women in UK households.
More Information
Economy
Feb 14, 2020
This chart shows Germany's real GDP growth compared to the preceding quarter.
More Information
Trump Administration
Feb 13, 2020
This chart shows the percentage of U.S. adults who said they are better off now than they were three years ago.
More Information
Trump Administration
Feb 13, 2020
This chart shows the percentage of people who say Trump's interaction with Iran has caused a chance of conflict.
More Information
Iran
Feb 13, 2020
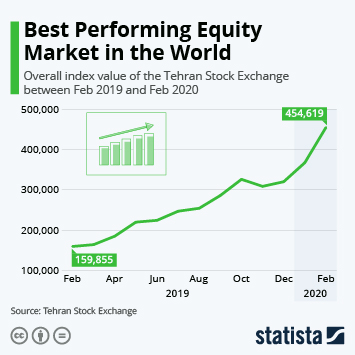
This chart shows the overall index value of the Tehran Stock Exchange between Feb. 2019 and Feb. 2020.
More Information
2020 Election
Feb 13, 2020
This chart shows the percentage of U.S. adults who believe other nations are trying to influence the 2018 and 2020 elections.
More Information
Entertainment
Feb 13, 2020
The chart shows the music streaming services with the most subscribers as of November 2019.
More Information
Food Waste
Feb 13, 2020
This chart shows the average daily food waste caused by consumers in selected countries (in kcal/day).
More Information
Elections
Feb 13, 2020
This chart shows the percentage of adults confident in the honesty of elections in selected countries
More Information
WhatsApp
Feb 13, 2020
This chart shows WhatsApp's user growth.
More Information
Coronavirus
Feb 13, 2020
This chart shows the share of the public agreeing that airlines in their country should stop flying to China.
More Information
Global Consumer Survey
Feb 13, 2020
This chart shows the share of UK smartphone users that regularly use dating apps, by relationship status in 2019.
More Information
2020 Presidential Election
Feb 13, 2020
This chart shows the percentage of people who think President Donald Trump will get reelected in November.
More Information
Air Pollution
Feb 13, 2020
This chart shows the economic costs of air pollution from fossil fuels as a share of GDP in 2018.
More Information
Propaganda
Feb 12, 2020
This chart shows the number of incidents of white supremacist propaganda in the U.S. between 2017-2019, and the major groups responsible.
More Information
NBA
Feb 12, 2020
This chart shows the value of NBA franchises in 2020 (in million U.S. dollars).
More Information
Tech
Feb 12, 2020
This infographic compares the antitrust fine served by the EU to Google in 2017 and the time it would take Google to earn that amount.
More Information
Cost of Living
Feb 12, 2020
This chart shows results from the Cost of Living Survey by News.com.au in 2020.
More Information
Pollution
Feb 12, 2020
Annual metric tons of mismanaged plastic waste and total amount ending up in global waters
More Information
SARS
Feb 12, 2020
This chart shows the estimated one-year impact of SARS on real GDP in selected countries/territories.
More Information
Mobile Gaming
Feb 12, 2020
This chart shows index scores for quality of mobile gaming over cellular networks in 2020.
More Information
Stock market
Feb 11, 2020
This chart shows the market valuation of the largest companies relative to the total valuation of the S&P 500 (in hundred billion U.S....
More Information
2020 Presidential Election
Feb 11, 2020
This chart shows how small business owners responded when asked, which candidate you would vote for in a potential matchup?
More Information
2020 Presidential Election
Feb 11, 2020
This chart shows the percentage of U.S. adults who would vote yes for a candidate possessing a given characteristic.
More Information
2020 Presidential Election
Feb 11, 2020
This chart shows how respondents answered when they were asked, if the Democratic primary were today, who would you vote for?
More Information
Rising Sea Levels
Feb 11, 2020
This chart shows the number of people per country affected by rising sea levels by 2100.
More Information
Korean Film Industry
Feb 11, 2020
This chart shows the total box office revenue in South Korea between 2004 and 2019 (in billion South Korean won).
More Information
Counterfeit Goods
Feb 11, 2020
This chart shows the suggested retail value of shipments seized at the U.S. border for intellectual property right violations.
More Information
Budget 2021
Feb 11, 2020
This chart compares the real GDP growth projected in the 2021 budget proposal to the latest forecasts by leading economists in the...
More Information
Coronavirus recoveries
Feb 11, 2020
This chart shows the estimated number of cases where patients recovered from the Wuhan coronavirus in 2020.
More Information
Farm Bankruptcies
Feb 11, 2020
This chart shows the number of Chapter 12 bankruptcies filed in the U.S. by year.
More Information
Democratic Primary
Feb 10, 2020
This chart shows the percentage of registered Democratic primary voters in New Hampshire who would vote for a given candidate.
More Information
Essential Brands
Feb 10, 2020
This chart shows the brands Americans claim they can't live without.
More Information
Transatlantic flights
Feb 10, 2020
This chart shows the fastest transatlantic flights between New York and London.
More Information
Coronavirus
Feb 10, 2020
This chart shows the estimated impact of the Wuhan coronavirus on the growth of global GDPs (2020 projections).
More Information
Ireland
Feb 10, 2020
This chart shows Sinn Féin's share of the vote in Irish general elections.
More Information
Health
Feb 10, 2020
This chart shows the global infections and deaths related to SARS and the Wuhan coronavirus.
More Information
2020 Presidential Election
Feb 7, 2020
This chart shows how registered voters answered when asked: If today were the 2020 presidential election, whom would you vote for?
More Information
Satellites
Feb 7, 2020
This chart shows the number of current satellites in orbit by country and type.
More Information
Broadband
Feb 7, 2020
This chart shows the estimated number of people without fixed broadband access in 2020.
More Information
Australia
Feb 7, 2020
This chart shows shares of all recognized animal species extinctions in Australia caused by invasive wild and feral species.
More Information
Uber
Feb 7, 2020
This chart shows Uber's operating results since 2016.
More Information
Digital Photography
Feb 7, 2020
This chart shows how many digital cameras the world's largest camera vendors shipped between 2003 and 2016.
More Information
Award Shows
Feb 7, 2020
This chart shows how much advertisers spent at major award shows in the United States in 2019.
More Information
Iowa Caucus
Feb 7, 2020
This chart shows percent of votes in the Iowa caucus 2020 for candidates in the Democratic presidential primary and corresponding delegate...
More Information
DNA
Feb 6, 2020
This chart shows the percentage of Americans and their views on DNA testing companies sharing genetic information with law enforcement.
More Information
Labor
Feb 6, 2020
This chart shows the average annual percent growth of labor productivity in the U.S. per year.
More Information
Trump Administration
Feb 6, 2020
This chart shows the percent of people internationally who have confidence in U.S. President Donald Trump.
More Information
Trump Administration
Feb 6, 2020
This chart shows how more than 6,000 people answered when they were asked: "Do you think Senator Mitt Romney should be expelled from...
More Information
Gambling in Macau
Feb 6, 2020
This chart shows gambling revenue in 2018 from some of the top gambling cities of the world.
More Information
Shipbreaking
Feb 6, 2020
This chart shows the number of ships scrapped worldwide by year.
More Information
U.S. Imports
Feb 6, 2020
This chart shows the countries with the largest absolute change in goods exports to the U.S. in 2019 compared to the previous year.
More Information
Radio
Feb 5, 2020
This chart shows the annual earnings of the highest-paid radio stars in the U.S.
More Information
Disney+
Feb 5, 2020
This chart shows the number of paying subscribers globally for ad-free streaming services as of February 2020.
More Information
Brands on Social Media
Feb 5, 2020
This chart shows the percent of respondents in each age group who have engaged in social commerce.
More Information
Music
Feb 5, 2020
This chart shows the songs which have been covered most often by other artists.
More Information
Entertainment
Feb 5, 2020
This chart shows the video streaming services with the most subscribers globally as of November 2019.
More Information
Emissions
Feb 5, 2020
This chart shows projected electricity generation in Australia by type in 2020, 2025 and 2030.
More Information
Tech
Feb 5, 2020
This chart shows the year-over-year growth of selected KPIs for Spotify in Q4 2019.
More Information
Casper IPO
Feb 5, 2020
This chart shows the revenue and net loss of direct-to-consumer mattress company Casper.
More Information
State Of The Union
Feb 5, 2020
This chart shows the longest State of the Union addresses since 1964.
More Information
Entertainment
Feb 5, 2020
This chart shows the podcasts/podcasters with the highest earnings in 2019.
More Information
YouTube
Feb 4, 2020
This chart shows how YouTube's ad revenue compares to major TV networks.
More Information
Conservation
Feb 4, 2020
This chart shows the population of the Western Monarch butterfly between 1997-2019, recorded annually by the Xerces Society.
More Information
Tesla
Feb 4, 2020
This chart shows the stock price of Tesla (TSLA) at the beginning of each month (in U.S. dollars).
More Information
Mental Health
Feb 4, 2020
This chart shows the percent of U.S. adults who are lonely, shown as demographics.
More Information
Music
Feb 4, 2020
This chart shows the songs which have been sampled most often by other artists.
More Information
83
/
161
Contact
Get in touch with us. We are happy to help.
Do you still have questions?
Feel free to contact us anytime using our
contact form
or visit our
FAQ page
.
Your contact to the Infographics Newsroom
Felix Richter
Data Journalist
felix.richter@statista.com
+49 (40) 284 841 557