Skip to main content
Consumer Goods & FMCG
E-Commerce
Economy & Politics
Energy & Environment
Health, Pharma & Medtech
Internet
Media
Technology & Telecommunications
Transportation & Logistics
Travel, Tourism & Hospitality
View all industries
Global data volume growth
Global AI market size
Number of generative AI users worldwide
Global inflation rate
Retail e-commerce sales worldwide
Largest economies worldwide
Biggest social media platforms by users
Global EV market share by manufacturer
International tourist arrivals by world region
Global annual CO₂ emissions
Browse recent statistics
Artificial intelligence (AI) worldwide
TikTok
Nvidia
E-commerce worldwide
Global GDP
Instagram
Apparel market worldwide
Video gaming worldwide
Global renewable energy industry
Influencer marketing worldwide
Browse recent topics
Consumer Trends 2026
Artificial Intelligence: in-depth market analysis
E-commerce challenges
Global economy
TikTok
Luxury goods: in-depth market analysis
Electric vehicles: A global overview
Video gaming worldwide
Travel and tourism trends 2026
Battery recycling worldwide
Browse recent reports
Explore the tool
Explore Classic mode
Advertising & Media
eCommerce
Consumer
Finance
Global Indicators
Health
Industrial
Mobility
Technology
Explore Market Insights
eCommerce Insights
Research AI
Book a demo
All integrations
Developer docs
Explore Statista Connect
Research
Strategy & Consulting
Marketing
Media & PR
Explore AI assistants
Marketing
Research & Development
Strategy
Sales
Find the fact
Tell the story
Win the pitch
Understand the market
Develop your strategy
Academia
Agencies
Consultancies
Consumer goods
Finance
Tech
Research solutions
Strategy consulting
Communication services
Explore Statista+
Statista R
Statista Healthcare
About Statista
First steps & help center
Webinar & training hub
Success stories
Individuals & Small Teams
Businesses & Enterprises
Academia & Government
English
Deutsch
Daily Data
Global stories vividly visualized
Climate Change
Jan 16, 2020
This chart shows the Environmental Performance Index (EPI) score and relative ranking for 10 notable countries.
More Information
Renewable Energy
Jan 16, 2020
This chart shows the percentage of energy production relative to the total energy production of the U.S. from 2002-2018.
More Information
Economics
Jan 16, 2020
This chart shows the change in global merchandise trade volume Q1-Q3 2018 to Q1-Q3 2019 of world's top ten traders.
More Information
Health
Jan 16, 2020
This chart shows the share of all global deaths in 2017, by most common causes.
More Information
Term Limits
Jan 16, 2020
This chart shows the term limits of selected heads of government around the world.
More Information
Retail
Jan 16, 2020
This chart shows the number of major retail store openings and closures in the U.S. announced in 2018 and 2019.
More Information
The British Royal Family
Jan 16, 2020
This chart shows the net worth and annual salary of members of the British royal family for 2018 to 2019.
More Information
E-Scooter Accidents
Jan 16, 2020
This chart shows the e-scooter injury rate and type of injuries recorded in the United States.
More Information
Vaccines
Jan 15, 2020
This chart shows the percentage of people in each category who believe it's important for parents to vaccinate their children.
More Information
Population
Jan 15, 2020
This chart shows the population and relative labor force of Russia between 1990-2018 (in millions).
More Information
Car Sales
Jan 15, 2020
This chart shows the car models with most unit sales in Japan in 2019.
More Information
Climate Change
Jan 15, 2020
This chart shows the percentage of people who responded "Yes" to certain questions centered on climate change.
More Information
Airliner Shootdowns
Jan 15, 2020
This chart shows selected incidents where commercial aircraft were shot down.
More Information
2020
Jan 15, 2020
This chart shows the minutes spoken in the January 14 televised Democratic debate.
More Information
Airbus & Boeing
Jan 14, 2020
This chart shows the number of Airbus A380 aircrafts delivered from 2007 to 2019.
More Information
Volcano
Jan 14, 2020
This chart shows the death toll of five of the largest volcanic eruptions in the last 20 years.
More Information
Wikipedia Day
Jan 14, 2020
This chart shows the Wikipedia articles with most views in 2019 (in millions).
More Information
Entertainment
Jan 14, 2020
This chart shows the time needed to watch all episodes of selected animated comedies as of January 2020.
More Information
Apps
Jan 14, 2020
This chart shows annual revenue generated by KakaoTalk Gift (in billion Won).
More Information
2020 Election
Jan 14, 2020
This chart shows the share of U.S. voters saying how ready they/others felt for a female president (2019).
More Information
Best Picture Nominees
Jan 14, 2020
This chart shows the global box office revenue of this year's Best Picture nominees.
More Information
Soccer
Jan 14, 2020
This chart shows the football clubs with the most revenue in 2018/19.
More Information
Suicide
Jan 14, 2020
This chart shows the total number of workplace suicides in the U.S. by year.
More Information
Jobs
Jan 13, 2020
This chart shows the total nonfarm jobs created in the U.S. each year along with the change in unemployment rate over a decade.
More Information
Citizenship Amendment Act
Jan 13, 2020
This chart shows the Indian states with the highest number of districts recording violent incidents/police action and deaths during...
More Information
The Way We Work is Changing
Jan 13, 2020
This infographic looks at how the way we work is changing.
More Information
Global Meat Industry
Jan 13, 2020
This chart shows the sales of traditional meat and meat substitutes in billions of U.S. dollars from 2025 to 2040.
More Information
Royal Family
Jan 13, 2020
This chart shows the share of UK adults who support/oppose the move.
More Information
Democratic Primary
Jan 13, 2020
This chart shows the support of New Hampshire voters who are likely to vote in the Democratic presidential primary.
More Information
Music Streaming
Jan 13, 2020
This chart shows the number of songs streamed on demand in the United States since 2013.
More Information
Microsoft
Jan 13, 2020
This chart shows Microsoft's share price since Bill Gates stepped down as CEO.
More Information
Health
Jan 13, 2020
This chart shows the number of deaths due to alcohol-related illnesses in the United States.
More Information
Windows 7 Discontinuation
Jan 13, 2020
This chart shows global desktop operating system market share in December 2019.
More Information
E-Commerce
Jan 10, 2020
This chart shows the number of Macy's stores that closed in the U.S.
More Information
New York Residential Real Estate
Jan 10, 2020
This chart shows the number of people leaving a U.S. state, from 2010 to 2019.
More Information
Border Wall
Jan 9, 2020
This chart shows fund allocated to the building of wall on the U.S.-Mexican border.
More Information
Antisemitism
Jan 9, 2020
This chart shows the percent of U.S. adults who think it is anti-Semitic to...
More Information
10 Years Haiti Earthquake
Jan 9, 2020
This chart shows the earthquakes since 1900 which caused the most deaths.
More Information
Australia Fires
Jan 9, 2020
This chart shows daily average PM2.5 pollution levels in selected cities in Australia, India and China in Dec 2019/Jan 2020.
More Information
Tech Acquisitions
Jan 9, 2020
This chart shows the acquisition price of tech companies.
More Information
Cyber Attacks
Jan 9, 2020
This chart shows the most commonly exploited applications worldwide.
More Information
Smart Speakers
Jan 9, 2020
This chart shows estimates on smart speaker ownership in the United States.
More Information
Ghosn
Jan 9, 2020
This chart provides an overview of the Carlos Ghosn Case.
More Information
Royal Family
Jan 9, 2020
This chart shows the share of the UK public feeling the following is treated least favourably by the media.
More Information
Cancer
Jan 8, 2020
This chart shows the cancer death rates per 100,000 people in the U.S.
More Information
Economy
Jan 8, 2020
This chart shows the share of Asian CEOs expecting the global/local economy to deteriorate sharply or steadily (2020).
More Information
Iran
Jan 8, 2020
This chart shows the share of survey respondents saying the approved/disapproved of President Trump's actions on Iran (2020).
More Information
Citizenship Amendment Act
Jan 8, 2020
This chart shows how Indians from different regions view the Citizenship Amendment Act.
More Information
Automobile Manufacturers
Jan 8, 2020
This chart shows market capitalization of the largest U.S. automobile manufacturers.
More Information
Wildfires
Jan 8, 2020
The 2019 Australian wildfires and other recent wildfire events by acreage burned.
More Information
Yellowstone
Jan 7, 2020
This chart shows the number of annual eruptions of the Steamboat geyser in Yellowstone National Park (1961-2019).
More Information
Wine
Jan 7, 2020
This chart shows the top 5 non-EU countries by wine exports from the EU in 2018.
More Information
Driver's License
Jan 7, 2020
This chart shows the percentage of the U.S. population holding a driver's license, by age group (1983, 2008, 2018).
More Information
Wine
Jan 7, 2020
This chart provides a regional breakdown of worldwide wine production in 2018.
More Information
Australian Fires
Jan 6, 2020
This chart shows mean annual temperature anomaly in Australia and the world on the basis of the mean annual temperature between 1961...
More Information
Middle East
Jan 6, 2020
This chart shows the estimated annual funding Iran provies to foreign states and militant groups it supports.
More Information
U.S. Troops
Jan 6, 2020
This chart shows the estimated number of U.S. troops based in Middle Eastern countries.
More Information
Marijuana
Jan 3, 2020
This chart shows the percent of U.S. adults who say marijuana...
More Information
Trump Administration
Jan 3, 2020
This chart shows the percent of Americans who admire Barack Obama or President Donald Trump the most.
More Information
Gen Z
Jan 3, 2020
This chart shows the percent of U.S. adults who know someone who prefers gender neutral pronouns.
More Information
The British Royal Family
Jan 3, 2020
This chart shows the amount of top five finishes for Gallup's Most Admired poll.
More Information
Immigration Detention
Jan 3, 2020
This chart shows the number of detainees in facilities under DHS since 1994.
More Information
Free-to-Play Games
Jan 3, 2020
This chart shows worldwide revenue generated with free-to-play video games in 2019, by platform.
More Information
Smartphones
Jan 3, 2020
This chart shows the smartphones with the longest-lasting batteries on the market.
More Information
Fortnite
Jan 3, 2020
This chart ranks the top 5 free-to-play digital games by worldwide revenue in 2019.
More Information
Apple
Jan 3, 2020
This chart shows the current market value of $1,000 invested in Apple shares at selected turning points in the company's history.
More Information
UK Politics
Jan 3, 2020
This chart shows who Labour party members say would be their first choice leadership candidate in December 2019.
More Information
Netflix
Jan 2, 2020
This chart shows experts predicting a best picture win at the 2020 Oscars (in percent).
More Information
Social Media
Jan 2, 2020
This chart shows the reasons U.S. adults used Facebook less (in percent).
More Information
Trump Administration
Jan 2, 2020
This chart shows the percent of U.S. adults who say reporters have low moral standards.
More Information
2020 Presidential Election
Jan 2, 2020
This chart shows the percentage of voters who will vote in the 2020 Democratic Presidential primary or caucus.
More Information
YouTube
Jan 2, 2020
This chart shows the percentage of U.S. adults who say they have used the listed platforms or apps.
More Information
E-Commerce
Jan 2, 2020
This chart shows how likely U.S. adults are by age to order a low cost item from Amazon Prime vs. buying in-store.
More Information
Airbnb
Jan 2, 2020
This chart shows the estimated number of guests staying at Airbnb listings worldwide on New Year's Eve.
More Information
Household Expenditure
Jan 2, 2020
This chart shows eating out as a share of total household expenditure in 2018.
More Information
Year in Review
Jan 2, 2020
Annual gains of selected major stock market indices in 2019.
More Information
End of the Decade
Jan 2, 2020
This chart shows selected technology sector projections for the next decade as of December 2019.
More Information
United States
Jan 2, 2020
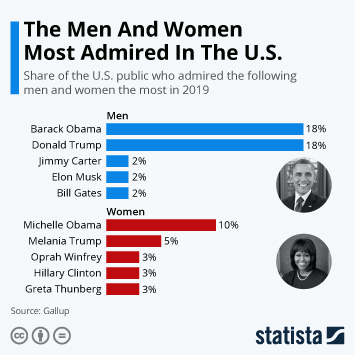
This chart shows the share of the U.S. public who admired the following men and women the most in 2019.
More Information
2020
Jan 2, 2020
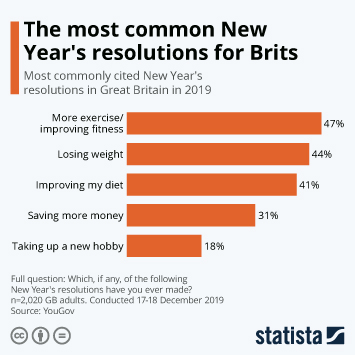
This chart shows the most commonly cited New Year's resolutions in Great Britain.
More Information
Trump Administration
Dec 23, 2019
This chart shows what issue was most important to millionaires heading into the 2020 presidential election.
More Information
Trump Administration
Dec 23, 2019
This chart shows how important is it for U.S. senators to be impartial during an impeachment process.
More Information
Netflix
Dec 20, 2019
This chart shows the percent of U.S. adults who are more entertained by online streaming than cable TV.
More Information
Star Wars
Dec 20, 2019
This chart shows how U.K. fans answered when asked, which one do you think is the best hero from the Star Wars films?
More Information
Trump Administration
Dec 20, 2019
This chart shows projected percent of U.S. adults who approve or disapprove of President Donald Trump.
More Information
U.S. Employment
Dec 20, 2019
This chart shows how U.S. adults responded when asked, "Have you gotten a pay raise at your current job or gotten a new job with pay...
More Information
Voice Commerce
Dec 20, 2019
This chart shows the percent of U.S. adults who are comfortable or not listening to a recording of their own voice.
More Information
Nordics
Dec 20, 2019
This chart is a ranking of brands in Finland based on recognition and public perception.
More Information
Pollution
Dec 20, 2019
This chat shows the estimated number of premature pollution-related deaths per year.
More Information
Research
Dec 20, 2019
This chart shows the number of science & engineering articles published in peer reviewed journals in 2018.
More Information
Media and Politics in the U.S.
Dec 19, 2019
This chart shows the percent of U.S. adults who have a favorable opinion of Capitalism and Socialism.
More Information
85
/
161
Contact
Get in touch with us. We are happy to help.
Do you still have questions?
Feel free to contact us anytime using our
contact form
or visit our
FAQ page
.
Your contact to the Infographics Newsroom
Felix Richter
Data Journalist
felix.richter@statista.com
+49 (40) 284 841 557