Skip to main content
Consumer Goods & FMCG
E-Commerce
Economy & Politics
Energy & Environment
Health, Pharma & Medtech
Internet
Media
Technology & Telecommunications
Transportation & Logistics
Travel, Tourism & Hospitality
View all industries
Global data volume growth
Global AI market size
Number of generative AI users worldwide
Global inflation rate
Retail e-commerce sales worldwide
Largest economies worldwide
Biggest social media platforms by users
Global EV market share by manufacturer
International tourist arrivals by world region
Global annual CO₂ emissions
Browse recent statistics
Artificial intelligence (AI) worldwide
TikTok
Nvidia
E-commerce worldwide
Global GDP
Instagram
Apparel market worldwide
Video gaming worldwide
Global renewable energy industry
Influencer marketing worldwide
Browse recent topics
Consumer Trends 2026
Artificial Intelligence: in-depth market analysis
E-commerce challenges
Global economy
TikTok
Luxury goods: in-depth market analysis
Electric vehicles: A global overview
Video gaming worldwide
Travel and tourism trends 2026
Battery recycling worldwide
Browse recent reports
Explore the tool
Explore Classic mode
Advertising & Media
eCommerce
Consumer
Finance
Global Indicators
Health
Industrial
Mobility
Technology
Explore Market Insights
eCommerce Insights
Research AI
Book a demo
All integrations
Developer docs
Explore Statista Connect
Research
Strategy & Consulting
Marketing
Media & PR
Explore AI assistants
Marketing
Research & Development
Strategy
Sales
Find the fact
Tell the story
Win the pitch
Understand the market
Develop your strategy
Academia
Agencies
Consultancies
Consumer goods
Finance
Tech
Research solutions
Strategy consulting
Communication services
Explore Statista+
Statista R
Statista Healthcare
About Statista
First steps & help center
Webinar & training hub
Success stories
Individuals & Small Teams
Businesses & Enterprises
Academia & Government
English
Deutsch
Daily Data
Infographics on the topic "coronavirus"
Health
Jul 2, 2020
This chart shows annual average public health expenditure per person (2016-2018).
More Information
Covid-19 Pandemic
Jul 1, 2020
This chart shows U.S. states with a positive case rate over 10% on June 30, 2020.
More Information
COVID-19
Jun 30, 2020
This chart shows Americans' opinions on the severity of COVID-19 and how closely they're following news on the pandemic.
More Information
Taxes
Jun 30, 2020
This chart shows the number of audits initiated by the IRS in April and May of 2019 and 2020.
More Information
COVID-19 Outbreak
Jun 30, 2020
This chart shows the share who agree that their government's priority regarding COVID-19 should be...
More Information
Education
Jun 29, 2020
This chart shows the percentage of U.S. college students who say they should pay less tuition for online classes due to COVID-19 restrictions.
More Information
Coronavirus
Jun 29, 2020
This chart shows figures related to daily Covid-19 deaths as reported by the UK government.
More Information
COVID-19 Outbreak
Jun 29, 2020
This chart shows the change in revenue of selected startup sectors since the start of the pandemic.
More Information
Google Advertising
Jun 29, 2020
This chart shows Google's estimated U.S. advertising revenue.
More Information
COVID-19 bailouts
Jun 26, 2020
This chart shows the government bailouts for selected airlines in Europe in 2020.
More Information
COVID-19
Jun 26, 2020
This chart shows the net share of respondents who said they consumed the specific drugs on more days than usual during the COVID-19...
More Information
Aviation
Jun 26, 2020
This chart shows total domestic pilots in Pakistan and the number with wrongfully acquired licenses.
More Information
COVID-19
Jun 25, 2020
This chart shows COVID-19 cases per 100,000 people in the U.S. by state.
More Information
COVID-19 Pandemic
Jun 25, 2020
This chart shows countries and territories scored on COVID-19 safety levels (June 03, 2020).
More Information
COVID-19
Jun 24, 2020
This chart shows the monthly outstanding total balance of corporate loans in South Korea and its monthly increase in 2020 (in billion...
More Information
COVID-19 Outbreak
Jun 24, 2020
This chart shows the percentage change in spending by all consumers compared to the same period in 2019.
More Information
COVID-19 Outbreak
Jun 24, 2020
This chart shows the number of COVID-19 tests carried out per million of the population.
More Information
COVID-19
Jun 22, 2020
This chart shows U.S. states which meet the demand for contact tracers based on COVID-19 case counts.
More Information
Cruise Industry
Jun 22, 2020
This chart shows some quick facts on Carnival Cruises second quarter earnings report.
More Information
COVID-19 in India
Jun 22, 2020
This chart shows the countries most likely to believe COVID-19 myths (2020).
More Information
Covid-19
Jun 22, 2020
This chart shows the share of UK respondents likely to avoid the following for a while even after Covid-19 restrictions are lifted.
More Information
Professional Sports
Jun 19, 2020
This chart shows when major European football leagues will return after being suspended due to the COVID-19 pandemic.
More Information
Protective Masks
Jun 19, 2020
This chart shows the percentage of respondents who wear a face mask outside in response to the COVID-19 pandemic.
More Information
COVID-19 Lockdowns
Jun 18, 2020
This chart compares COVID-19 containment responses in selected countries according to the University of Oxford Coronavirus Government...
More Information
Internet
Jun 18, 2020
This chart shows the percentage of U.S. adults by age who say the internet has been essential or not important during COVID-19.
More Information
COVID-19
Jun 17, 2020
This chart shows the percentage growth rates in daily cases and deaths for the following U.S. metro areas.
More Information
Wages & Salary
Jun 17, 2020
This chart shows the average tech worker salary in U.S. cities in 2020.
More Information
COVID-19 Outbreak
Jun 17, 2020
This chart shows the number of COVID-19 cases in the following locations (as of June 16, 2020).
More Information
Startups in India
Jun 17, 2020
This chart shows the self-declared financial situation of startups and SMEs in India according to a survey by Local Circles (June 2020).
More Information
COVID-19 Pandemic
Jun 16, 2020
This chart shows reported hospitalizations, ICU admissions and deaths among U.S. COVID-19 patients.
More Information
COVID-19 Outbreak
Jun 16, 2020
This chart shows the share of people who would use an app providing information on people infected with Covid-19.
More Information
Economy
Jun 16, 2020
This chart shows the number of claimants of UK unemployment benefits from January 2008 to May 2020.
More Information
COVID-19
Jun 16, 2020
This chart shows the percentage of U.S. adults who agree/disagree on allowing businesses to open even if COVID-19 isn't fully contained.
More Information
Economy
Jun 16, 2020
This chart shows the percentage of U.S. adults on their opinion of the state of the U.S. economy.
More Information
COVID-19
Jun 15, 2020
This chart shows the index scores of consumer sentiment from the University of Michigan between June 2019 and June 2020.
More Information
Unemployment
Jun 15, 2020
This chart shows the unemployment rates by gender and ethnicity between May 2020 and the Great Recession.
More Information
Coronavirus
Jun 15, 2020
This chart shows the country of origin of Covid-19 importation events in the UK.
More Information
COVID-19 Pandemic
Jun 15, 2020
This chart shows the share saying social distancing should/should not be required at the national conventions.
More Information
Economy
Jun 12, 2020
This chart shows the percentage growth rate for local commerce in selected U.S. cities.
More Information
Real Estate
Jun 12, 2020
This chart shows the percent year-over-year change in new leases for May 2020 in New York City.
More Information
E-Commerce in India
Jun 12, 2020
This chart shows the increase in the price of some grocery delivery items on e-commerce platforms in India during the COVID-19 pandemic.
More Information
Economic Cycles
Jun 12, 2020
This chart shows the length of economic expansions in the United States since World War II.
More Information
Navajo & Hopi
Jun 11, 2020
This chart shows the number of COVID-19 cases across Navajo Nation and Hopi Reservation between March 18 - June 9, 2020.
More Information
Energy
Jun 10, 2020
This chart shows some statistics from a World Bank report on people without basic sources of energy around the world.
More Information
Gaming
Jun 10, 2020
This chart shows some statistics on the viewership in 2020 of popular streaming platform Twitch.
More Information
COVID-19 Outbreak
Jun 10, 2020
This chart shows the steps U.S. employers are taking to avoid spreading COVID-19.
More Information
COVID-19 in India
Jun 10, 2020
This chart shows the share of retailers declaring selected FMCG items out-of-stock in India during the coronavirus crisis (March 1-June...
More Information
Stock Market
Jun 9, 2020
This chart shows the number of Robinhood user positions in the S&P 500 (in millions).
More Information
COVID-19 Pandemic
Jun 9, 2020
This chart shows the estimated number of averted deaths due to COVID-19 intervention.
More Information
COVID-19 Pandemic
Jun 9, 2020
This chart shows the number of COVID-19 cases recorded by U.S. meat processing companies (June 08, 2020).
More Information
Economic Impact of COVID-19
Jun 9, 2020
This chart shows the percentage point change in real GDP growth projections for 2020 due to the COVID-19 pandemic.
More Information
Employment
Jun 9, 2020
This chart shows the time period in which UK employers think the hiring situation will return to pre-Covid-19 levels in the country.
More Information
Economic Impact of COVID-19
Jun 9, 2020
This chart shows a GDP growth forecast for selected economies (as of June 2020).
More Information
COVID-19
Jun 9, 2020
This chart shows the number of new daily cases of COVID-19 in New Zealand.
More Information
COVID-19 Test Kits
Jun 8, 2020
This charts shows the monthly value of COVID-19 test kit export from South Korea in 2020 (as of May).
More Information
Coronavirus
Jun 8, 2020
This chart shows the total confirmed COVID-19 deaths in Brazil.
More Information
United States
Jun 8, 2020
This chart shows how registered U.S. voters feel things are in their country.
More Information
Coronavirus
Jun 8, 2020
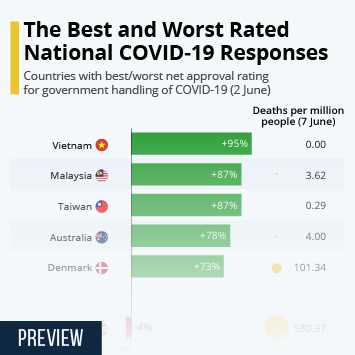
This chart shows the countries with best/worst net approval rating for the government handling of COVID-19 with deaths per million...
More Information
Economic Impact of COVID-19
Jun 8, 2020
This chart shows the monthly unemployment rate in the U.S. since 1948.
More Information
Unemployment in the United States
Jun 8, 2020
This chart shows the seasonally adjusted unemployment rate in the United States.
More Information
Basketball
Jun 7, 2020
This chart shows some information on the format for the NBA restart in Orlando beginning July 31.
More Information
Unemployment
Jun 7, 2020
This chart shows the U.S. unemployment rates in April and May by race and ethnicity.
More Information
COVID-19
Jun 4, 2020
This chart shows the highest cumulative COVID-19 cases per 1,000 residents in each U.S. metro/micro area.
More Information
COVID-19 Pandemic
Jun 3, 2020
This chart shows COVID-19 deaths per 100,000 of the population (June 1, 2020).
More Information
Coronavirus
Jun 3, 2020
This chart shows the countries with the highest rolling 7-day averages for new COVID-19 deaths per million people.
More Information
LATAM
Jun 2, 2020
This chart shows the daily number of reported COVID-19 deaths for each country in the month of May, 2020.
More Information
COVID-19 Outbreak
Jun 2, 2020
This chart shows the chance of COVID-19 transmission based on the following scenarios*.
More Information
COVID-19 Impact on Mental Health
Jun 2, 2020
This chart shows the increase in weekly prescriptions for anti-anxiety, anti-insomnia and antidepressant medications in the U.S. between...
More Information
U.S. Protests
Jun 2, 2020
This chart shows National Guard deployments in response to protests, by state.
More Information
COVID-19
Jun 1, 2020
This chart shows the percentage of U.S. adults who have each opinion related to removing COVID-19 restrictions.
More Information
COVID-19 Outbreak
May 29, 2020
This chart shows the estimated share of the population with COVID-19 antibodies.
More Information
COVID-19
May 28, 2020
This chart shows the number of initial jobless claims filed each week in the U.S. (in thousands).
More Information
Baseball
May 28, 2020
This chart shows key stats comparing the KBO Korean Professional Baseball League and U.S. Major League Baseball (MLB).
More Information
COVID-19
May 28, 2020
This chart shows the percentage of U.S. adults doing each activity more often than a month ago.
More Information
COVID-19 Outbreak
May 28, 2020
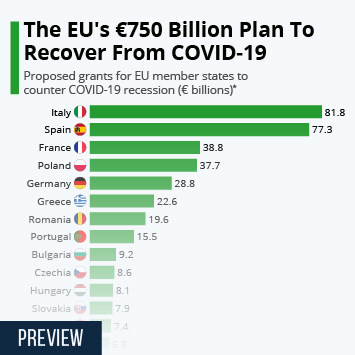
This chart shows proposed grants for EU member states to counter COVID-19 recession (€ billions).*
More Information
COVID-19 Pandemic
May 27, 2020
This chart shows daily reported COVID-19 cases by WHO region (Mar 01-May 25, 2020).
More Information
United Kingdom
May 27, 2020
This chart shows public opinion on Dominic Cummings' alleged breach of UK lockdown rules.
More Information
South Korean Exports
May 26, 2020
This chart shows the change in export value of selected products from South Korea in April 2020 (compared to April 2019).
More Information
Retail Brands
May 26, 2020
This chart shows the most valuable retail brands in the world in 2019.
More Information
COVID-19 Outbreak
May 26, 2020
COVID-19 deaths in long-term care facilities as a share of total COVID-19 deaths.
More Information
COVID-19 Impact on U.S. Job Market
May 25, 2020
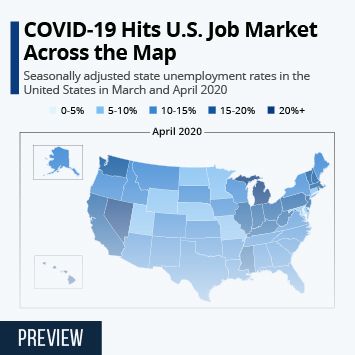
This chart shows the seasonally adjusted state unemployment rates in the United States in March and April 2020.
More Information
Alibaba
May 25, 2020
This chart compares the latest results of Amazon and Alibaba Group.
More Information
U.S. Bicycle Market
May 22, 2020
This chart shows year-over-year change in bicycle and bicycle service sales in the U.S. in March 2020.
More Information
COVID-19
May 22, 2020
This chart is a timeline of the total confirmed cases of the COVID-19 coronavirus in 2020.
More Information
Earnings
May 21, 2020
This chart shows highlights from Q1 earnings for Target's fiscal year of 2020.
More Information
COVID-19
May 21, 2020
This chart shows the percentage of U.S. adults in favor of medical care/economic aid for undocumented COVID patients.
More Information
COVID-19 & Inequality
May 20, 2020
This chart shows select New York City neighborhoods with the highest deaths per 100,000 people due to COVID-19.
More Information
Coronavirus
May 20, 2020
This chart shows the daily number of new COVID-19 deaths in Brazil.
More Information
Cyclones
May 20, 2020
This chart shows the deadliest cyclones to hit India and Bangladesh.
More Information
COVID-19 Outbreak
May 20, 2020
This chart shows the share who trust what the media says about COVID-19 in selected countries (5-13 May, 2020).
More Information
11
/
15
Contact
Get in touch with us. We are happy to help.
Do you still have questions?
Feel free to contact us anytime using our
contact form
or visit our
FAQ page
.
Your contact to the Infographics Newsroom
Felix Richter
Data Journalist
felix.richter@statista.com
+49 (40) 284 841 557