Skip to main content
Consumer Goods & FMCG
E-Commerce
Economy & Politics
Energy & Environment
Health, Pharma & Medtech
Internet
Media
Technology & Telecommunications
Transportation & Logistics
Travel, Tourism & Hospitality
View all industries
Global data volume growth
Global AI market size
Number of generative AI users worldwide
Global inflation rate
Retail e-commerce sales worldwide
Largest economies worldwide
Biggest social media platforms by users
Global EV market share by manufacturer
International tourist arrivals by world region
Global annual CO₂ emissions
Browse recent statistics
Artificial intelligence (AI) worldwide
TikTok
Nvidia
E-commerce worldwide
Global GDP
Instagram
Apparel market worldwide
Video gaming worldwide
Global renewable energy industry
Influencer marketing worldwide
Browse recent topics
Consumer Trends 2026
Artificial Intelligence: in-depth market analysis
E-commerce challenges
Global economy
TikTok
Luxury goods: in-depth market analysis
Electric vehicles: A global overview
Video gaming worldwide
Travel and tourism trends 2026
Battery recycling worldwide
Browse recent reports
Explore the tool
Explore Classic mode
Advertising & Media
eCommerce
Consumer
Finance
Global Indicators
Health
Industrial
Mobility
Technology
Explore Market Insights
eCommerce Insights
Research AI
Book a demo
All integrations
Developer docs
Explore Statista Connect
Research
Strategy & Consulting
Marketing
Media & PR
Explore AI assistants
Marketing
Research & Development
Strategy
Sales
Find the fact
Tell the story
Win the pitch
Understand the market
Develop your strategy
Academia
Agencies
Consultancies
Consumer goods
Finance
Tech
Research solutions
Strategy consulting
Communication services
Explore Statista+
Statista R
Statista Healthcare
About Statista
First steps & help center
Webinar & training hub
Success stories
Individuals & Small Teams
Businesses & Enterprises
Academia & Government
English
Deutsch
Daily Data
Infographics on the topic "coronavirus"
Covid-19 Outbreak
Sep 4, 2020
This chart shows the estimated impact of the Covid-19 crisis on airport revenue in 2020, by region.
More Information
Eviction crisis
Sep 4, 2020
This chart shows the number of Americans living in rental households and those at risk of eviction by the end of 2020.
More Information
COVID-19
Sep 4, 2020
This chart shows the percentage of U.S. adults who are completely satisfied with physical safety at work.
More Information
Remote Learning
Sep 3, 2020
This chart shows the number of students worldwide that can potentially be reached by digital and broadcast remote learning programs.
More Information
Covid-19 Outbreak
Sep 3, 2020
This chart shows the countries with the highest number of health worker deaths from Covid-19.
More Information
United Kingdom
Sep 2, 2020
This chart shows the value of claims made by companies under the UK's job retention scheme (in billion GBP).
More Information
Covid-19 Outbreak
Sep 2, 2020
This chart shows the share who agree that a Covid-19 vaccine will be available before the end of 2020.
More Information
Latin America
Sep 1, 2020
This chart shows the percent change in remittances compared with the same month in 2019.
More Information
Economy
Sep 1, 2020
This chart presents figures related to the UK's Eat Out to Help Out Scheme.
More Information
Covid-19 Outbreak
Aug 31, 2020
This chart shows the share saying their country has done a bad/good job dealing with the coronavirus outbreak.
More Information
Noodle Sales
Aug 28, 2020
This chart shows the percent change in the year-over-year quarterly revenue and net profit of Nissin Food Holdings.
More Information
Retail
Aug 28, 2020
This chart shows the percent growth in U.S. paper towel sales in 2020 vs. same week in 2019.
More Information
Covid-19 Outbreak
Aug 26, 2020
This chart shows the share who consider the number of U.S. coronavirus fatalities acceptable/unacceptable.
More Information
Airline Industry
Aug 26, 2020
This chart shows the number of pilots warned they could be furloughed in October.
More Information
COVID-19 Impact on Tourism
Aug 25, 2020
This chart shows global international tourism receipts from 2000-2019 and possible scenarios for 2020.
More Information
Retail
Aug 24, 2020
This chart shows the number of retail store closures in the United States.
More Information
Covid-19 Pandemic
Aug 24, 2020
This chart shows estimated views of health content from official/misinformation websites on Facebook in 2020.
More Information
Life in a Pandemic
Aug 21, 2020
This chart shows Americans' favorite evening activities during the pandemic.
More Information
Covid-19
Aug 21, 2020
This chart shows the countries and territories for which non-essential travel is advised against for people in the UK.
More Information
Covid-19
Aug 21, 2020
This chart shows the change in job approval of selected world leaders from March to August 2020.
More Information
Colleges & Universities
Aug 21, 2020
This chart shows some quick facts from a survey of college students across the U.S.
More Information
Income
Aug 20, 2020
This chart shows the percentage of U.S. adults who favor/oppose the federal government providing $1,000 a month for all adult citizens.
More Information
Women in the Workplace
Aug 19, 2020
This chart shows the share of management positions in Japanese companies held by women (2015-2020).
More Information
Great Britain
Aug 18, 2020
This chart reveals reported increases in depressive symptoms in British adults during the 2020 coronavirus pandemic.
More Information
Covid-19 Outbreak
Aug 17, 2020
Confirmed weekly Covid-19 cases and deaths in U.S. nursing homes in 2020
More Information
Economic outlook
Aug 17, 2020
This chart shows the percentage of U.S. cities reporting they are better or less able to meet their financial needs for each fiscal...
More Information
Trade
Aug 17, 2020
This chart shows tariffs imposed in the U.S.-China trade war between 2018 and 2020 as a cumulative value of affected imports.
More Information
Economics
Aug 14, 2020
This chart shows the estimated change in EU GDP compared with same quarter of the previous year as of Q2 2020.
More Information
Electric Vehicle Sales
Aug 13, 2020
This chart shows estimated sales of electric vehicles from January through June 2020.
More Information
Bankruptcies
Aug 13, 2020
This chart shows the number of bankruptcies in the U.S. by year.
More Information
Economy
Aug 13, 2020
This chart shows the quarterly GDP growth rate in the UK.
More Information
Exports
Aug 12, 2020
This chart shows the monthly value of South Korean pharmaceutical exports in 2019 and 2020.
More Information
Stock market
Aug 11, 2020
This chart shows the total value of U.S.-listed biotech IPOs through Aug. 7 of each year (in billion U.S. dollars).
More Information
Stock market
Aug 11, 2020
This chart shows the stock price for Eastman Kodak Company between Jul. 27 and Aug. 10 (in U.S. dollars).
More Information
Stock market
Aug 11, 2020
This chart shows the percent growth in overall price between Mar. 10 and Aug. 7 for each S&P 500 sector.
More Information
US citizenship
Aug 11, 2020
This chart shows individuals who renounced their US citizenship or terminated their long-term residency.
More Information
Covid-19 Outbreak
Aug 11, 2020
This chart shows the composition of Covid-19 rumors, stigma and conspiracy theories circulating on social media.
More Information
Covid-19
Aug 11, 2020
This chart shows the percentage change on previous quarter of number of people in employment in the UK from 2007 to 2020.
More Information
Covid-19 Outbreak
Aug 11, 2020
This chart shows the net income of selected U.S. health insurance providers.
More Information
Covid-19 Outbreak
Aug 10, 2020
This chart shows the share of U.S. adults willing to get an FDA approved, no cost vaccine for Covid-19.
More Information
Covid-19
Aug 7, 2020
This chart shows the share of people in the UK saying they wear a mask when in public places.
More Information
Covid-19 Outbreak
Aug 7, 2020
This chart shows the share of adults who experienced stress, anxiety or sadness that was difficult to cope with alone during the pandemic.
More Information
Mental health
Aug 7, 2020
This chart shows the percentage of U.S. adults who say worry/stress from the coronavirus has had a negative impact on their health.
More Information
COVID-19
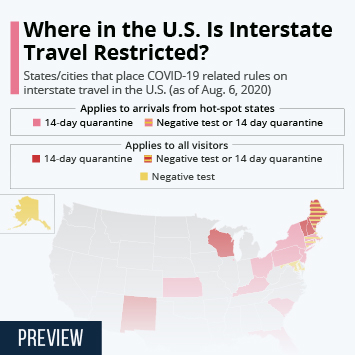
Aug 6, 2020
This chart shows restrictions on interstate travel in the U.S. because of the COVID-19 pandemic as of Aug 6, 2020.
More Information
U.S. Elections
Aug 6, 2020
This chart provides an overview of state rules on mail-in voting.
More Information
Household Consumption
Aug 5, 2020
This chart shows the year-over-year change in Japanese household consumption in households of two or more people, trend and inflation...
More Information
Education
Aug 4, 2020
This chart shows the percentage of U.S. parents preferring either full-time, part-time or no in-person fall school, by party.
More Information
Education
Aug 4, 2020
This chart shows the percentage of U.S. parents who want the following plan for their children returning to school in the fall.
More Information
Coal energy
Aug 4, 2020
This chart shows the growth in global coal power generation in the last five years (in Gigawatts).
More Information
Homicide
Aug 4, 2020
This chart shows the number of homicides in selected U.S. cities in 2019 and 2020.
More Information
Remittances
Aug 3, 2020
This chart shows the expected change in remittance payment to Asian countries from 2018 to 2020 as a result of the COVID-19 pandemic.
More Information
NBA
Jul 30, 2020
This chart shows the timeline of positive COVID-19 cases among NBA players and staff.
More Information
Covid-19 Outbreak
Jul 30, 2020
This chart shows Covid-19 deaths per 100,000 people in the U.S. by race or ethnicity.
More Information
Covid-19 Outbreak
Jul 30, 2020
This chart shows states with more than 100 new Covid-19 cases per 100,000 people in the past week.
More Information
Colleges and Universities
Jul 29, 2020
This chart shows the percentage of U.S. colleges utilizing each reopening plan for fall semester.
More Information
Tourism in Spain
Jul 28, 2020
This chart shows the number of international tourist arrivals in Spain, by country of origin.
More Information
Covid-19 Outbreak
Jul 28, 2020
This chart shows the estimated share of renter households facing a rental shortfall and potential eviction.
More Information
Economic Stimulus
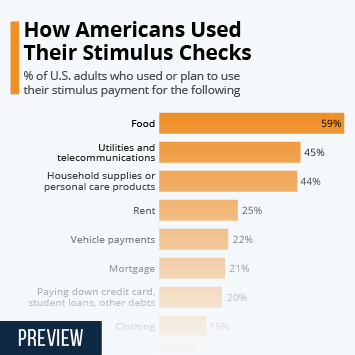
Jul 28, 2020
This chart shows how Americans used/planned to use the stimulus payments they received as part of the CARES Act.
More Information
Investing
Jul 28, 2020
This chart shows the correlation between gold and the U.S. dollar in 2020.
More Information
Covid-19 Outbreak
Jul 27, 2020
This chart shows the estimated cost of containing future pandemic compared to Covid-19's economic damage.
More Information
Covid-19 Outbreak
Jul 27, 2020
This chart shows the countries that are developing or that have rolled out Covid-19 tracing apps.
More Information
COVID-19 Outbreak
Jul 24, 2020
This chart shows nationwide prevalence of underlying conditions in U.S. adults in 2018.
More Information
Professional Sports
Jul 24, 2020
This chart shows American sports fans' opinions on when leagues should return from coronavirus shutdowns.
More Information
Big Tech
Jul 23, 2020
This chart shows the percentage of U.S. adults who say major tech companies should be regulated more than they currently are.
More Information
Airline Industry
Jul 23, 2020
This chart shows year-to-date stock performance of selected U.S. airlines.
More Information
United States Postal Service
Jul 23, 2020
This chart shows predicted United States Postal Service pandemic losses based on two scenarios.
More Information
Covid-19 Outbreak
Jul 22, 2020
This chart shows the status of state participation in Apple & Google's Exposure Notification API*.
More Information
IBM
Jul 21, 2020
This chart shows the percent change from the previous year in IBM's quarterly revenue.
More Information
Economic Impact of COVID-19
Jul 21, 2020
This chart shows the total contribution of travel and tourism to GDP of countries worst affected by the COVID-19 pandemic.
More Information
COVID-19
Jul 20, 2020
This chart shows the percentage of people saying the cost of food, groceries and household supplies has increased since COVID-19.
More Information
Retail
Jul 17, 2020
This chart shows the percent change from the previous month in U.S. retail sales figures for 2020.
More Information
COVID-19
Jul 17, 2020
This chart shows how often Americans use face masks in public, in percent.
More Information
Unemployment
Jul 16, 2020
This chart shows the percent change in unemployment since December 2019, by education and age.
More Information
COVID-19
Jul 16, 2020
This chart shows the average new cases a day in the past week and percent change from two weeks ago by U.S. state.
More Information
College & COVID
Jul 16, 2020
This chart shows U.S. college students' responses about lifestyle if colleges reopen in the fall.
More Information
Advertising
Jul 15, 2020
This chart shows the split between digital and traditional spending for advertising in the U.S. from 2017-2024.
More Information
COVID-19 Pandemic
Jul 14, 2020
This chart shows the status of U.S. state reopenings as of July 13, 2020.
More Information
GDP
Jul 10, 2020
This chart shows the biggest economies in the world by GDP (current prices/PPP) in 2019 and their growth prospects in 2020.
More Information
Airline Industry
Jul 10, 2020
This chart shows the U.S. share of airline capacity by number of available seats (in millions).
More Information
Economic Impact of COVID-19
Jul 9, 2020
This chart shows the share of U.S. adults whose household incomes had been negatively affected/not negatively affected by the COVID-19...
More Information
Jobs
Jul 8, 2020
This chart shows the unemployment rates by industry and class of worker for June 2020.
More Information
Unemployment
Jul 8, 2020
This chart shows labor force unemployment in selected OECD countries in February and May of 2020.
More Information
MLB
Jul 8, 2020
This chart shows the price of a hot dog in the MLB by team in 2019.
More Information
PPP Loans
Jul 7, 2020
This chart shows the Paycheck Protection Program coronavirus relief loans approved thru June 30, 2020 by size (in percent).
More Information
Pandemic
Jul 7, 2020
This chart maps a forecast of year-on-year real GDP change in Europe in 2020.
More Information
Food Delivery
Jul 7, 2020
This chart shows the percentage of total delivery sales made by each food delivery company in May 2020.
More Information
Coin Shortage
Jul 6, 2020
This chart shows the U.S. Mint's annual coin production for circulation from 2016-2020 (projected).
More Information
Auto Industry
Jul 6, 2020
This chart compares new car registrations in the United Kingdom as of June 2019 and 2020.
More Information
Real Estate
Jul 6, 2020
This chart shows some quick facts on the second quarter sales of apartments in Manhattan, New York, in 2020.
More Information
U.S. Job Market
Jul 3, 2020
This chart shows the change in total private nonfarm payroll employment in June 2020, by industry.
More Information
10
/
15
Contact
Get in touch with us. We are happy to help.
Do you still have questions?
Feel free to contact us anytime using our
contact form
or visit our
FAQ page
.
Your contact to the Infographics Newsroom
Felix Richter
Data Journalist
felix.richter@statista.com
+49 (40) 284 841 557