Skip to main content
Consumer Goods & FMCG
E-Commerce
Economy & Politics
Energy & Environment
Health, Pharma & Medtech
Internet
Media
Technology & Telecommunications
Transportation & Logistics
Travel, Tourism & Hospitality
View all industries
Global data volume growth
Global AI market size
Number of generative AI users worldwide
Global inflation rate
Retail e-commerce sales worldwide
Largest economies worldwide
Biggest social media platforms by users
Global EV market share by manufacturer
International tourist arrivals by world region
Global annual CO₂ emissions
Browse recent statistics
Artificial intelligence (AI) worldwide
TikTok
Nvidia
E-commerce worldwide
Global GDP
Instagram
Apparel market worldwide
Video gaming worldwide
Global renewable energy industry
Influencer marketing worldwide
Browse recent topics
Consumer Trends 2026
Artificial Intelligence: in-depth market analysis
E-commerce challenges
Global economy
TikTok
Luxury goods: in-depth market analysis
Electric vehicles: A global overview
Video gaming worldwide
Travel and tourism trends 2026
Battery recycling worldwide
Browse recent reports
Explore the tool
Explore Classic mode
Advertising & Media
eCommerce
Consumer
Finance
Global Indicators
Health
Industrial
Mobility
Technology
Explore Market Insights
eCommerce Insights
Research AI
Book a demo
All integrations
Developer docs
Explore Statista Connect
Research
Strategy & Consulting
Marketing
Media & PR
Explore AI assistants
Marketing
Research & Development
Strategy
Sales
Find the fact
Tell the story
Win the pitch
Understand the market
Develop your strategy
Academia
Agencies
Consultancies
Consumer goods
Finance
Tech
Research solutions
Strategy consulting
Communication services
Explore Statista+
Statista R
Statista Healthcare
About Statista
First steps & help center
Webinar & training hub
Success stories
Individuals & Small Teams
Businesses & Enterprises
Academia & Government
English
Deutsch
Daily Data
Infographics on the topic "joe biden"
Iranian Nuclear Program
Dec 7, 2020
This chart shows known assassinations of figures associated with Iran's nuclear program.
More Information
2020 Election
Nov 17, 2020
This chart shows the aggregate vote won as a share of U.S. GDP in recent presidential elections.
More Information
Politics
Nov 17, 2020
This chart shows the percentage of U.S. voters who favor either a unified or divided government, by candidate supported.
More Information
Paris Climate Agreement
Nov 12, 2020
This chart shows the share of the U.S. public who would support/oppose rejoining the Paris Climate Agreement.
More Information
Trump Administration
Nov 11, 2020
This chart shows the estimated number of times President Trump played golf since his inauguration.
More Information
Covid-19 Outbreak
Nov 11, 2020
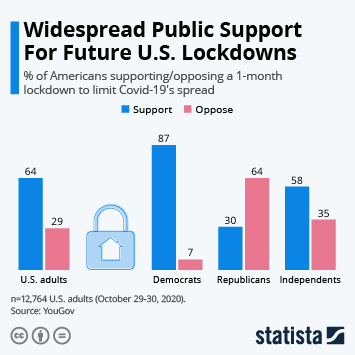
This chart shows the share of Americans supporting/opposing a 1-month lockdown.
More Information
2020 Election
Nov 10, 2020
This chart shows the Electoral College results of the 2020 U.S. presidential election.
More Information
2020 Election
Nov 9, 2020
This chart shows gains of selected currencies against the U.S. dollar on Monday, 9.11.2020, after the U.S. election was called for...
More Information
2020 Election
Nov 6, 2020
This chart shows the number of days after the U.S. presidential election until the unsuccessful candidate conceded.
More Information
Climate change
Nov 6, 2020
This chart shows the U.S. states that have passed legislation requiring a transition to 100 percent renewable or carbon-free electricity.
More Information
2020 Election
Nov 5, 2020
This chart shows the results from exit polls on decisive issues in the 2020 presidential election.
More Information
2020 Election
Nov 4, 2020
This chart shows voting-eligible population turnout rates in U.S. presidential elections since 1900.
More Information
2020 Election
Nov 3, 2020
This chart shows survey answers on how Democrats/Republicans were planning to vote in the 2020 U.S. presidential elections.
More Information
2020 Election
Nov 3, 2020
This chart show the projected electoral college votes in the 2020 U.S. presidential election based on polling averages.
More Information
2020 Election
Nov 3, 2020
This chart shows 2020 general election editorial endorsements by major U.S. newspapers.
More Information
2020 Election
Nov 2, 2020
This chart shows average poll margins in favor of Donald Trump/Joe Biden in major swing states in the 2020 presidential election.
More Information
2020 Election
Nov 2, 2020
This chart shows the percentage of U.S. registered voters who voted in each presidential election year, by race/ethnicity.
More Information
2020 Election
Nov 2, 2020
This chart shows the selection countries by their believe that either Donald Trump or Joe Biden would win the 2020 U.S. presidential...
More Information
2020 Election
Nov 1, 2020
This chart shows the percentage of voters who would vote for each candidate in 2020.
More Information
2020 Election
Oct 30, 2020
This chart shows the percentage of U.S. adults who are in favor of abolishing the electoral college system.
More Information
2020 Elections
Oct 29, 2020
This chart shows donations raised by 2020 presidential candidates (as of Oct 14, 2020).
More Information
2020 Election
Oct 28, 2020
This chart shows the percentage of voters who would vote for each candidate if the election were today.
More Information
2020 Election
Oct 23, 2020
This chart shows the percentage of Americans who are satisfied with the way things are going in the U.S., by party.
More Information
Trust in Science
Oct 21, 2020
This chart shows the level of public trust in scientists by political leaning in selected countries.
More Information
2020 Election
Oct 21, 2020
This chart shows the percentage of U.S. farmers who said they would vote for each candidate if the election were held today.
More Information
2020 Election
Oct 20, 2020
This chart shows the percentage of U.S. voters who said each year's presidential election matters more than in previous years.
More Information
2020 Election
Oct 15, 2020
This chart shows money raised by respective election campaigns in 2020.
More Information
2020 Election
Oct 13, 2020
This chart shows the share of the public who want Biden/Trump to win the U.S. presidential election.
More Information
2020 Election
Oct 8, 2020
This chart shows the percentage of U.S. voters who said they expect voting to be difficult for each upcoming election.
More Information
2020 Election
Oct 8, 2020
This chart shows minutes spoken in the October 07, 2020 televised vice presidential debate.
More Information
2020 Election
Oct 7, 2020
This chart shows the percentage of U.S. adults who want either the same party or different parties controlling the presidency and Congress.
More Information
2020 Election
Oct 6, 2020
This chart shows U.S. public opinion on the likelihood of a peaceful power transition if Joe Biden is elected.
More Information
2020 Election
Oct 5, 2020
This chart shows the percentage of U.S. voters from each party who said each issue is important for their vote.
More Information
2020 Election
Sep 30, 2020
This chart shows minutes spoken in the September 29, 2020 televised presidential debate.
More Information
2020 Election
Sep 30, 2020
This chart shows the share of debate watchers who think Trump/Biden won.
More Information
Politics
Sep 29, 2020
This chart shows the percentage of Americans who say social media companies should allow political ads on their platforms.
More Information
Trump Taxes
Sep 29, 2020
This chart shows federal income tax payments by presidents in the first year of their administration.
More Information
2020 Presidential Election
Sep 25, 2020
This chart shows the emotional response evoked by possible outcomes of the 2020 election.
More Information
2020 Election
Sep 23, 2020
This chart shows the percentage of U.S. voters who are very closely following national politics, by presidential election year.
More Information
2020 Election
Sep 18, 2020
This chart shows the percentage of U.S. adults who believe the presidential election will be decided within each timeframe.
More Information
2020 Election
Sep 18, 2020
This chart shows the percentage of U.S. adults who say it's likely/not likely there will be mass protests if Donald Trump is reelected.
More Information
2020 Election
Sep 18, 2020
This chart shows the political action committees spending the highest amount of money on the 2020 election (as of Sept 17, 2020).
More Information
Media bias
Sep 16, 2020
This chart shows the percentage of people who say bias in media toward others or themselves concerns them more.
More Information
2020 Election
Sep 15, 2020
This chart shows the percentage of U.S. voters who say each issue is the most important when voting for president.
More Information
2020 Election
Sep 15, 2020
This chart shows the percentage of U.S. voters who say each issue is the most important when voting for president.
More Information
2020 Election
Sep 10, 2020
This chart shows the percent Republican share of the presidential vote in selected types of suburbs.
More Information
Covid-19
Sep 10, 2020
this chart shows the estimated number of preventable U.S. Covid-19 deaths if control measures had been implemented earlier.
More Information
2020 Election
Sep 8, 2020
This chart shows the percentage of U.S. adults who said each ticket is better for their personal finances.
More Information
2020 Election
Sep 1, 2020
This chart shows the share of active-duty service members with a favorable/unfavorable view of Donald Trump
More Information
2020 Election
Sep 1, 2020
This chart shows who U.S. military service members would vote for in the November election.
More Information
2020 Election
Aug 28, 2020
This chart shows the percentage of supporters for each candidate who say each characteristic makes the U.S. stronger/weaker.
More Information
2020 Election
Aug 27, 2020
This chart shows the percentage of voters by demographic who would vote for each candidate if the election were today.
More Information
2020 U.S. Elections
Aug 26, 2020
This chart shows the number of Democratic/Republican wins in U.S. states in the past 10 presidential elections (1980-2016).
More Information
2020 election
Aug 15, 2020
This chart shows the percentage of registered voters who rate Kamala Harris as Joe Biden's running mate in the following ways.
More Information
2020 Presidential Election
Aug 12, 2020
This chart shows the share of registered Democrat voters with a positive/negative opinion of Kamala Harris.
More Information
Twitter Hack
Jul 16, 2020
This chart shows the largest Twitter accounts compromised in the hack on July 15, 2020, by number of followers.
More Information
2020 Election
Jun 26, 2020
This chart shows a summary of campaign data on Democratic presidential candidate Joe Biden's fundraising as of June 2020.
More Information
2020 Election
Jun 17, 2020
This chart shows the percentage of U.S. women who would vote for each candidate if the election were today.
More Information
Earth Day
Apr 18, 2020
This chart shows the percentage of U.S. adults who say climate change is a major threat.
More Information
Presidential election
Apr 1, 2020
This chart shows the percentage of U.S. voters who would vote for each candidate if the elections were held today.
More Information
Delegate Tracker
Mar 18, 2020
This chart shows the delegates collected by candidates for the Democratic nomination for the U.S. presidential candidate in 2020 (as...
More Information
Democratic Primary
Mar 16, 2020
This chart shows the polling averages for states voting on March 17 for the Democratic primary.
More Information
2020 Election
Mar 10, 2020
This chart shows polling numbers ahead of the March 10 primaries in six U.S. states.
More Information
Democratic Primary
Mar 9, 2020
This chart shows the polling averages for selected states voting on March 10 for the Democratic presidential primary.
More Information
2020 Elections
Mar 9, 2020
This chart shows polling averages for the potential presidential race match-ups in the U.S. 2020 elections (as of March 9, 2020).
More Information
2020 Election
Mar 6, 2020
This chart shows how the single highest donation differs between candidates for the nomination in the 2020 presidential elections (as...
More Information
Super Tuesday
Mar 3, 2020
This chart shows polling averages for selected U.S. states participating in Super Tuesday in 2020.
More Information
2020 Election
Feb 28, 2020
This chart shows polling averages for Nevada, South Carolina and the U.S. ahead of the 2020 Democratic presidential elections.
More Information
2020 Presidential Election
Feb 26, 2020
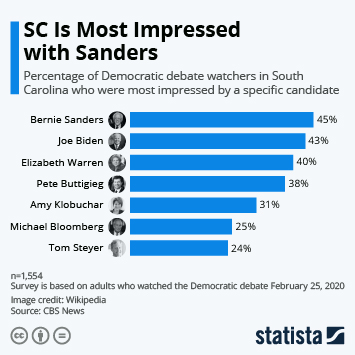
This chart shows the percentage of Democratic debate watchers in South Carolina who were most impressed by a specific candidate.
More Information
2020 Presidential Election
Feb 26, 2020
This chart shows the percentage of Democratic registered voters in New York voting for a specific candidate.
More Information
U.S. Politics
Feb 25, 2020
This chart shows the number of billionaires (or their spouses) that donated to Democratic presidential candidates in 2019.
More Information
2020 Elections
Feb 24, 2020
This chart shows support Democratic candidates for the U.S. presidential elections in 2020.
More Information
2020 Election
Feb 24, 2020
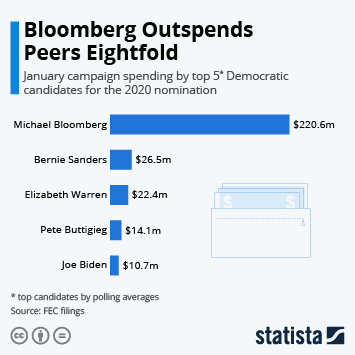
This chart shows campaign spend in January 2020 by the top 5 candidates for the Democratic nomination in the 2020 U.S. presidential...
More Information
2020 Election
Feb 20, 2020
This chart shows the minutes spoken in the February 19 televised Democratic debate.
More Information
2020 Election
Feb 20, 2020
This chart shows cumulative minutes spoken during past DNC debates among candidates for the Democratic party nomination in the 2020...
More Information
2020 Election
Feb 17, 2020
This chart shows money spent by 2020 presidential and presidential primary candidates on digital ads.
More Information
2020 Presidential Election
Feb 11, 2020
This chart shows how small business owners responded when asked, which candidate you would vote for in a potential matchup?
More Information
2020 Presidential Election
Feb 11, 2020
This chart shows how respondents answered when they were asked, if the Democratic primary were today, who would you vote for?
More Information
Democratic Primary
Feb 10, 2020
This chart shows the percentage of registered Democratic primary voters in New Hampshire who would vote for a given candidate.
More Information
Iowa Caucus
Feb 7, 2020
This chart shows percent of votes in the Iowa caucus 2020 for candidates in the Democratic presidential primary and corresponding delegate...
More Information
Trump Administration
Feb 6, 2020
This chart shows the percent of people internationally who have confidence in U.S. President Donald Trump.
More Information
2020 Election
Feb 3, 2020
This chart shows polling averages for Iowa, New Hampshire and the U.S. ahead of the 2020 Democratic presidential primaries.
More Information
2020 Election
Feb 3, 2020
This chart shows total donations for candidate committees in the 2020 presidential general election and primaries (as of Q4, 2019).
More Information
2020 Election
Jan 31, 2020
This chart shows the percentage of Democratic voters on how good a job primaries will be in selecting a general election candidate.
More Information
2020 Election
Jan 29, 2020
This chart shows the 2020 Democratic primary candidates perceived as most honest.
More Information
Democratic Primary
Jan 23, 2020
This chart shows the percentage of registered Democrats/Democratic-leaning independents who are most likely to support a given candidate.
More Information
Endorsements
Jan 20, 2020
This chart shows the 2020 Democratic primary candidates with most valuable endorsements.
More Information
Democratic Primary
Jan 13, 2020
This chart shows the support of New Hampshire voters who are likely to vote in the Democratic presidential primary.
More Information
2020 Presidential Election
Jan 2, 2020
This chart shows the percentage of voters who will vote in the 2020 Democratic Presidential primary or caucus.
More Information
Trump Administration
Dec 17, 2019
This chart shows how U.S. adults answered when asked, "Has President Donald Trump..."
More Information
4
/
5
Contact
Get in touch with us. We are happy to help.
Do you still have questions?
Feel free to contact us anytime using our
contact form
or visit our
FAQ page
.
Your contact to the Infographics Newsroom
Felix Richter
Data Journalist
felix.richter@statista.com
+49 (40) 284 841 557