Skip to main content
Consumer Goods & FMCG
E-Commerce
Economy & Politics
Energy & Environment
Health, Pharma & Medtech
Internet
Media
Technology & Telecommunications
Transportation & Logistics
Travel, Tourism & Hospitality
View all industries
Global data volume growth
Global AI market size
Number of generative AI users worldwide
Global inflation rate
Retail e-commerce sales worldwide
Largest economies worldwide
Biggest social media platforms by users
Global EV market share by manufacturer
International tourist arrivals by world region
Global annual CO₂ emissions
Browse recent statistics
Artificial intelligence (AI) worldwide
TikTok
Nvidia
E-commerce worldwide
Global GDP
Instagram
Apparel market worldwide
Video gaming worldwide
Global renewable energy industry
Influencer marketing worldwide
Browse recent topics
Consumer Trends 2026
Artificial Intelligence: in-depth market analysis
E-commerce challenges
Global economy
TikTok
Luxury goods: in-depth market analysis
Electric vehicles: A global overview
Video gaming worldwide
Travel and tourism trends 2026
Battery recycling worldwide
Browse recent reports
Explore the tool
Explore Classic mode
Advertising & Media
eCommerce
Consumer
Finance
Global Indicators
Health
Industrial
Mobility
Technology
Explore Market Insights
eCommerce Insights
Research AI
Book a demo
All integrations
Developer docs
Explore Statista Connect
Research
Strategy & Consulting
Marketing
Media & PR
Explore AI assistants
Marketing
Research & Development
Strategy
Sales
Find the fact
Tell the story
Win the pitch
Understand the market
Develop your strategy
Academia
Agencies
Consultancies
Consumer goods
Finance
Tech
Research solutions
Strategy consulting
Communication services
Explore Statista+
Statista R
Statista Healthcare
About Statista
First steps & help center
Webinar & training hub
Success stories
Individuals & Small Teams
Businesses & Enterprises
Academia & Government
English
Deutsch
Daily Data
Infographics on the topic "joe biden"
U.S. Presidential election
Jul 12, 2024
This chart shows the share of registered voters who would describe Trump & Biden as honest, mentally sharp, embarrassing or mean-spirited.
More Information
2024 presidential election
Jul 4, 2024
This chart shows the share of registered voters who think that Joe Biden/Donal Trump are "just too old to be an effective president".
More Information
Retirement
Jul 4, 2024
This chart shows the average effective labor market exit age of selected countries in 2017-2022, by gender.
More Information
2024 Presidential Election
Jun 27, 2024
This chart shows the estimated TV viewership of U.S. presidential debates.
More Information
2024 Presidential Election
Jun 27, 2024
This chart shows whether or not Americans are looking forward to the 2024 presidential election.
More Information
Cybercrime
May 31, 2024
This chart shows money lost in worldwide cybercrime complaints reported to the FBI.
More Information
Student Loan Forgiveness
Apr 12, 2024
Total U.S. federal student loans and amount canceled by Biden-Harris administration (in billion U.S. dollars).
More Information
Cybersecurity
Mar 13, 2024
This chart shows the countries per region with biggest increases in deepfake-specific fraud cases.
More Information
Land Mines
Mar 1, 2024
This chart shows countries which have/have not signed and ratified the Ottawa Mine Ban Treaty of 1999.
More Information
Presidents' Day
Feb 19, 2024
This chart shows retrospective job approval ratings of the last ten U.S. Presidents.
More Information
U.S. Southern Border
Feb 12, 2024
This chart shows the number of migrants apprehended and migrants deemed inadmissible at the Southern U.S. border.
More Information
Fossil fuels
Feb 7, 2024
This chart shows the biggest importers of U.S. LNG.
More Information
2024 Campaign Finance
Feb 2, 2024
This chart shows money on hand, raised and spent by the campaign committees of major candidates for U.S. president in 2024.
More Information
U.S. Presidential Election
Jan 23, 2024
This chart shows the implied probability of potential vice presidential candidates for Donald Trump abased on betting odds.
More Information
Presidential Election 2024
Oct 17, 2023
Thic chart shows major candidates for presidential primaries, by filing date.
More Information
2024 Campaign Finance
Oct 17, 2023
This chart shows Candidate committees which raised most funds ahead of the 2024 election (in million U.S. dollars)
More Information
Congress
Oct 4, 2023
This chart shows the percentage of U.S. adults who approve of the way Congress is handling their job.
More Information
U.S. Image Abroad
Sep 12, 2023
This chart shows the share of respondents from selected countries with a favorable view of the United States in 2023 (in percent).
More Information
Guantanamo
Sep 11, 2023
This chart shows the number of detainees held at the Guantánamo military prison (2002-2023).
More Information
U.S. Election
Sep 8, 2023
This chart shows the percentage of Republican voters who would vote for the following contenders in the 2024 GOP presidential primary...
More Information
World Leaders
Apr 14, 2023
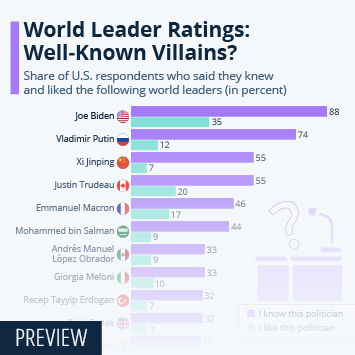
This chart shows the share of U.S. respondents who said they knew and liked the following world leaders (in percent).
More Information
U.S. politics
Apr 14, 2023
This chart shows the share of U.S. adults that think the following politicians are doing a good job.
More Information
Artificial Intelligence
Mar 29, 2023
This chart shows the share of respondents most confident in the following institutions to regulate or govern artificial intelligence.
More Information
Ukraine
Feb 23, 2023
This chart shows visits of heads of state/government as well as UN and EU leaders to Ukraine since Feb. 24, 2022.
More Information
Social Media
Feb 10, 2023
This chart shows the length of Donald Trump's social media ban by platform.
More Information
U.S. Governors
Nov 15, 2022
This chart shows the number of Democratic and Republican governors between 1990 and 2023.
More Information
2022 Midterm Elections
Nov 4, 2022
This chart shows the total number of votes by state as of November 2, 2022.
More Information
Crime
Nov 2, 2022
This chart shows the share of U.S. adults who said that there was more crime in their area than a year ago (in percent).
More Information
Student Debt
Aug 25, 2022
This chart shows the average student loan debt per borrower in U.S. states in 2022.
More Information
Build Back Better Agenda
Aug 12, 2022
This chart shows the components of the Inflation Reduction Act and the proposed human infrastructure bill of 2021 (in billion U.S....
More Information
Microchips
Aug 1, 2022
This chart shows countries with the biggest export values of electronic integrated circuits in 2020 (in billion U.S. dollars).
More Information
Midterms 2022
Jul 18, 2022
This chart shows the share of self-decribed Democratic primary voters saying the following about a renomination of Joe Biden.
More Information
Energy
Jul 11, 2022
This chart shows crude oil production, maximum production and monthly OPEC production quotas for Saudi Arabia.
More Information
Filibusters
Jul 4, 2022
This chart shows the numbers of cloture motions filed in the Senate, by term.
More Information
Guns
May 31, 2022
This chart shows the violent deaths involving a firearm per 100,000 population in the world's biggest economies in 2018.
More Information
School Shootings
May 30, 2022
This chart shows the number of K-12 school shooting in the U.S. per decade since 1980.
More Information
U.S. and Asia
May 23, 2022
Approval of U.S., Chinese and German leadership in Asia (in percent).
More Information
Presidential Clemency
Apr 28, 2022
This chart shows the number of executive clemency actions granted by U.S. presidents since 1933.
More Information
Politics
Apr 19, 2022
This chart shows the change in approval rating of U.S. President Biden from 2021 to 2022, by generation group.
More Information
Politics
Jan 25, 2022
This chart shows the highest lobbying spending in the tech industry in the U.S.
More Information
Trust In Government
Jan 19, 2022
This chart shows the share trusting the government and change from 2020 to 2021.
More Information
Omicron Wave
Jan 14, 2022
This chart shows the share of ICU beds in use in U.S. hospitals registered with HHS (as of Jan 13, 2022).
More Information
International Trade
Jan 13, 2022
This chart shows the share of global payments made in U.S. dollar and Euro (based on transaction value).
More Information
International Relations
Dec 3, 2021
This chart shows the percentage of Americans and Germans describing both countries' relationship as bad.
More Information
World Leaders
Nov 25, 2021
This chart shows the world leaders with the most followers on Twitter as of Nov 25, 2021.
More Information
COVID-19 Vaccination
Nov 3, 2021
This chart shows the share of employed Americans who said their employer encourages/requires vaccination against COVID-19.
More Information
Politics
Nov 2, 2021
This chart shows President Biden job approval and the share of U.S. adults saying the country is headed in the wrong direction in 2021.
More Information
Democratic Party
Oct 25, 2021
This chart shows the share of self-identifying U.S. Democrats who describe their political ideology as liberal, moderate or conservative...
More Information
Taliban Takeover
Aug 23, 2021
This chart shows the share of U.S. respondents who said the following about who carries responsibility for the Taliban takeover.
More Information
Air Travel
Jun 29, 2021
This chart shows commercial airspace by risk level as of June 24, 2021.
More Information
Infrastructure
Jun 25, 2021
This chart shows the average age of different types of infrastructure in the U.S. 2020-2021 (in years).
More Information
Juneteenth
Jun 16, 2021
This chart shows survey responses among U.S. adults about Juneteenth (2021).
More Information
Belarus Crisis
May 25, 2021
This chart shows where Belarus ranks globally in major international surveys/reports.
More Information
Covid-19 Pandemic
May 19, 2021
This chart shows the number of vaccine doses produced and exported as of March 2021.
More Information
COVID-19 Vaccines
Apr 28, 2021
This chart shows how the Biden administration met its vaccine goals for Biden's first 100 days in office.
More Information
Solar Energy
Apr 21, 2021
This chart shows the country market shares of different products of global solar photovoltaic manufacturing in 2019, by production...
More Information
Afghanistan
Apr 15, 2021
This chart shows the length of U.S. involvement in foreign military conflicts as of April 2021
More Information
Biden Press Conference
Mar 25, 2021
This chart shows the average number of press conference held by sitting U.S. presidents and days until first solo conference.
More Information
Foreign policy
Mar 4, 2021
This chart shows the percentage of U.S. adults who say America should remain a member of each group.
More Information
Foreign relations
Feb 24, 2021
This chart shows the percentage of U.S. adults who are confident President Biden will deal with China effectively.
More Information
Education
Feb 17, 2021
This chart shows the percentage of U.S. voters who say schools should wait to reopen until all teachers are vaccinated.
More Information
Popular Vote
Feb 12, 2021
This chart shows the performance of U.S. presidents in the popular vote since 1824.
More Information
Politics
Feb 11, 2021
This chart shows the percentage of U.S. adult Republicans who say Joe Biden's election victory was legitimate, by level of college...
More Information
Deportations
Feb 11, 2021
This chart shows the number of foreign nationals subject to formal deportation proceedings vs. informal returns in the U.S.
More Information
Electric Vehicles
Feb 11, 2021
This chart shows the number of U.S. federal vehicles in each department fleet (in thousands).
More Information
Economy
Feb 10, 2021
This chart shows the estimated U.S. federal spending and tax revenue with $15 minimum wage (in billion U.S. dollars).
More Information
Labor Force Participation
Feb 8, 2021
This chart shows the change in the labor force participation rate of men and women of different races/ethnicites in the U.S. in 2020.
More Information
Magazine Media
Feb 4, 2021
This chart shows the number of issues of Time magazine with selected presidents on their covers.
More Information
Private Prisons
Jan 29, 2021
This chart shows fact and figure about private prisons in the United States.
More Information
Immigration
Jan 29, 2021
This chart shows the percentage of U.S. adults who support/oppose a 100-day ban on deportations in the country.
More Information
Immigration
Jan 28, 2021
This chart shows the percentage of Americans in support of a path to citizenship for undocumented immigrants.
More Information
2020 Election
Jan 22, 2021
This chart shows the age of post-World War II U.S. presidents when they took office.
More Information
Religion
Jan 21, 2021
This chart shows the number of U.S. presidents publicly affiliated with each religion.
More Information
Immigration to the U.S.
Jan 21, 2021
This chart shows approved initial applications for the Deferred Action for Childhood Arrivals program per million population, by state,...
More Information
Presidential Pets
Jan 20, 2021
This chart shows the estimated number of White House pets by president from 1789 to 2021.
More Information
Death Penalty
Jan 19, 2021
This chart shows the days between federal executions in the U.S. since 1963.
More Information
Biden Cabinet
Jan 19, 2021
This chart shows cabinet positions and presumed positions in the Biden administration (2021).
More Information
2021 Presidential Inauguration
Jan 19, 2021
This chart shows reported troop levels in Afghanistan, Iraq, Syria & Washington D.C. as of January 19, 2021.
More Information
Anti-Government Groups
Jan 18, 2021
This chart shows the number of anti-government/'patriot' groups in the U.S.
More Information
2020 Election
Jan 11, 2021
This chart shows the percentage of U.S. adults who support/oppose Trump not attending Biden inauguration.
More Information
Trump administration
Jan 11, 2021
This chart shows the share who think Trump should be removed from office before his first term ends.
More Information
Trump
Jan 8, 2021
This chart shows the percentage of U.S. adults who support/oppose the storming of the Capitol building on Jan. 6, 2021.
More Information
U.S. Congress
Jan 7, 2021
This chart shows which party held the majority in the U.S. House of Representatives and the U.S. Senate upon election from 1900 to...
More Information
2020 Election
Jan 7, 2021
This chart shows the percentage of U.S. adults who said they feel justified to use violence to advance political goals.
More Information
2020 Election
Jan 6, 2021
This chart shows the percentage of U.S. voters who say President Trump's election court losses are for each reason.
More Information
Year in Review
Jan 5, 2021
This chart shows the most read Wikipedia articles of 2020.
More Information
Coronavirus
Jan 4, 2021
This chart shows the influence the coronavirus outbreak had on selected Asian stock indices (2020/21).
More Information
Year in Review
Jan 4, 2021
This chart shows annual gains of selected major stock market indices in 2020.
More Information
"Person of the Year"
Dec 10, 2020
This chart shows recipients of Time magazine's "Person of the Year" title, by category.
More Information
Google Searches
Dec 10, 2020
This chart shows the most common search terms on Google in the U.S. in 2020.
More Information
3
/
5
Contact
Get in touch with us. We are happy to help.
Do you still have questions?
Feel free to contact us anytime using our
contact form
or visit our
FAQ page
.
Your contact to the Infographics Newsroom
Felix Richter
Data Journalist
felix.richter@statista.com
+49 (40) 284 841 557