Skip to main content
Consumer Goods & FMCG
E-Commerce
Economy & Politics
Energy & Environment
Health, Pharma & Medtech
Internet
Media
Technology & Telecommunications
Transportation & Logistics
Travel, Tourism & Hospitality
View all industries
Global data volume growth
Global AI market size
Number of generative AI users worldwide
Global inflation rate
Retail e-commerce sales worldwide
Largest economies worldwide
Biggest social media platforms by users
Global EV market share by manufacturer
International tourist arrivals by world region
Global annual CO₂ emissions
Browse recent statistics
Artificial intelligence (AI) worldwide
TikTok
Nvidia
E-commerce worldwide
Global GDP
Instagram
Apparel market worldwide
Video gaming worldwide
Global renewable energy industry
Influencer marketing worldwide
Browse recent topics
Consumer Trends 2026
Artificial Intelligence: in-depth market analysis
E-commerce challenges
Global economy
TikTok
Luxury goods: in-depth market analysis
Electric vehicles: A global overview
Video gaming worldwide
Travel and tourism trends 2026
Battery recycling worldwide
Browse recent reports
Explore the tool
Explore Classic mode
Advertising & Media
eCommerce
Consumer
Finance
Global Indicators
Health
Industrial
Mobility
Technology
Explore Market Insights
eCommerce Insights
Research AI
Book a demo
All integrations
Developer docs
Explore Statista Connect
Research
Strategy & Consulting
Marketing
Media & PR
Explore AI assistants
Marketing
Research & Development
Strategy
Sales
Find the fact
Tell the story
Win the pitch
Understand the market
Develop your strategy
Academia
Agencies
Consultancies
Consumer goods
Finance
Tech
Research solutions
Strategy consulting
Communication services
Explore Statista+
Statista R
Statista Healthcare
About Statista
First steps & help center
Webinar & training hub
Success stories
Individuals & Small Teams
Businesses & Enterprises
Academia & Government
English
Deutsch
Daily Data
Infographics on the topic "uk"
Internet Shutdowns
Jan 6, 2021
This chart shows the number of recorded internet shutdowns in India between 2012 2020.
More Information
Covid-19
Jan 5, 2021
This chart shows levels of support for a nationwide lockdown in the UK in 2021.
More Information
Year in Review
Jan 4, 2021
This chart shows annual gains of selected major stock market indices in 2020.
More Information
Society
Dec 16, 2020
This chart reveals the Christmas plan/behaviour changes in the UK in 2020.
More Information
G7
Dec 16, 2020
This chart shows the largest economies by share of global GDP (in purchasing power parity).
More Information
AI
Dec 15, 2020
This chart shows productivity increases due to artificial intelligence application expected per country until 2035.
More Information
5G
Dec 10, 2020
This chart shows the projected 5G market penetration in selected countries by 2025 (as of December 2020).
More Information
Health
Dec 10, 2020
This chart looks at the share of Covid-19 vaccines purchased by wealth nations.
More Information
Internet
Dec 10, 2020
This chart shows the search terms which had the largest increases in 2020 compared to 2019.
More Information
Travel
Dec 10, 2020
This chart shows the most popular destinations for U.S. resident travelers in 2019 as well as the countries where traveler volume most...
More Information
Pandemic
Dec 9, 2020
This chart shows the year-on-year change in ticket revenue for UK performing arts venues in 2020.
More Information
Employment
Dec 7, 2020
This chart shows the average time spend with one employer in selected OECD countries in 2019.
More Information
Environment
Dec 4, 2020
This chart shows the total annual territorial UK greenhouse gas emissions from 1990 to 2019.
More Information
Covid-19
Dec 3, 2020
This chart shows the vaccination timeline for the Pfizer/BioNTech Covid-19 BNT162b2 vaccine.
More Information
Health
Dec 2, 2020
This chart shows the number of confirmed doses of Covid-19 vaccines secured by the UK.
More Information
UK Fishing
Dec 1, 2020
This chart shows the quantity of fish landed by UK vessels in the UK and abroad in 2019 (in tonnes).
More Information
Business
Nov 30, 2020
This chart shows the highest ranked countries on the World Bank's "Ease of Doing Business" index (2020).
More Information
Society
Nov 27, 2020
This chart shows the most and least trusted professions in Great Britain.
More Information
Covid-19
Nov 26, 2020
This infographic shows the number of cars manufactured in the United Kingdom in March of 2019 and 2020.
More Information
Economy
Nov 25, 2020
This chart shows the forecast public sector net borrowing of the UK.
More Information
UK
Nov 24, 2020
This chart shows the results of a survey into who the UK public think would make the best prime minister in November 2020.
More Information
Hate Crime
Nov 24, 2020
Incidents of hate crimes reported against fans at matches in England and Wales in the 2019-20 season.
More Information
Retail
Nov 23, 2020
This chart shows forecast annual changes in Black Friday footfall in the UK in 2020, by retail destination.
More Information
Economy
Nov 20, 2020
This chart shows the countries with the largest estimated annual losses due to tax abuse as a share of total tax revenue collected.
More Information
Economy
Nov 20, 2020
This chart shows the countries responsible for the highest annual tax losses to other countries.
More Information
Environment
Nov 19, 2020
This chart shows the energy mix of the UK in 2019.
More Information
Automotive
Nov 18, 2020
This chart shows the share of new UK car registrations in 2020, by fuel type.
More Information
Covid-19
Nov 16, 2020
This chart shows the change in active job postings in the UK from March to October 2020, by region.
More Information
Covid-19 Outbreak
Nov 11, 2020
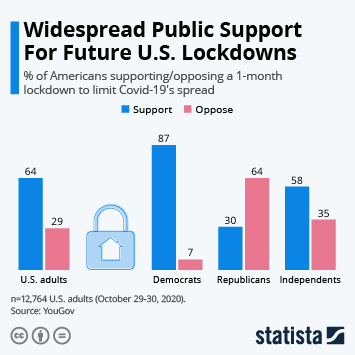
This chart shows the share of Americans supporting/opposing a 1-month lockdown.
More Information
Mobility
Nov 10, 2020
This chart shows the number of public electric vehicle charging devices per 100,000 population in the UK in October 2020.
More Information
Coronavirus
Nov 6, 2020
This chart shows the number of Covid-19 patients in the UK that are in mechanical ventilation beds.
More Information
Video-on-Demand
Nov 3, 2020
This chart shows the share of U.S. adults who have paid for the following video-on-demand services in the last 12 months.
More Information
2020 Election
Nov 2, 2020
This chart shows the selection countries by their believe that either Donald Trump or Joe Biden would win the 2020 U.S. presidential...
More Information
Tourism
Oct 30, 2020
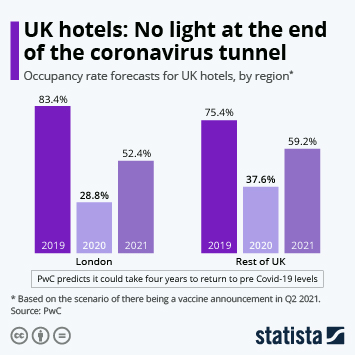
This chart shows UK hotel occupancy forecasts from 2019 to 2021.
More Information
Transportation
Oct 29, 2020
This chart shows 2020 passenger numbers at Europe's busiest airports as of 30 September and year-on-year change.
More Information
UK
Oct 28, 2020
This chart shows the share of furloughed workers in the UK that have since lost their jobs entirely.
More Information
United States
Oct 27, 2020
This chart shows the share of the U.S. public with a positive/negative view of different countries.
More Information
Trust in Science
Oct 21, 2020
This chart shows the level of public trust in scientists by political leaning in selected countries.
More Information
Tech
Oct 19, 2020
This chart shows the apps that people in the UK say they could least do without in 2020.
More Information
Covid-19 Pandemic
Oct 15, 2020
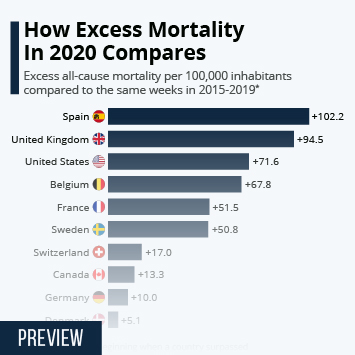
This chart shows excess all-cause mortality per 100,000 inhabitants compared to the same weeks in 2015-2019.
More Information
iPhone 11
Oct 14, 2020
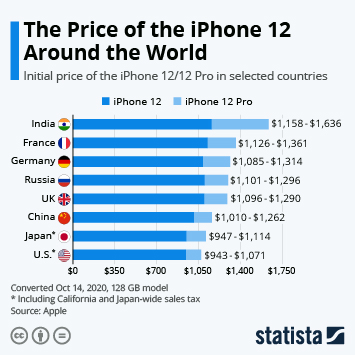
This chart shows the initial price of the iPhone 12 in different countries.
More Information
2020 Election
Oct 13, 2020
This chart shows the share of the public who want Biden/Trump to win the U.S. presidential election.
More Information
Nobel Prize
Oct 8, 2020
This chart shows Nobel Prizes awarded in the sciences since 1969 by country and share of immigrant researchers.
More Information
Occupational Safety
Oct 8, 2020
This chart shows the share of workers who say they have been seriously injured on the job as of 2020.
More Information
Coronavirus
Oct 6, 2020
This chart shows the share of U.S. adults that say they are scared to some degree of contracting Covid-19.
More Information
COVID-19
Sep 25, 2020
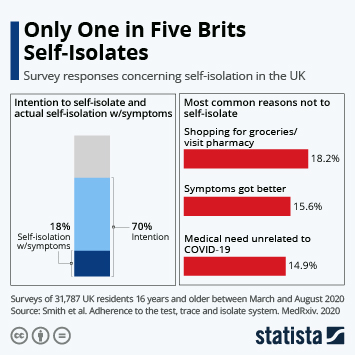
This chart shows the number of Brits intending to self-isolate when experiencing COVID-19 like symptoms and the number of Brits actually...
More Information
United Kingdom
Sep 25, 2020
This chart shows the people most admired by Britons in 2020.
More Information
Automobile Industry
Sep 24, 2020
This chart shows the largest markets in terms of new passenger car/light vehicle registrations in 2019.
More Information
COVID-19
Sep 22, 2020
This chart shows the projected increase of business insolvencies in 2021 compared with 2019 (in percent).
More Information
Health
Sep 18, 2020
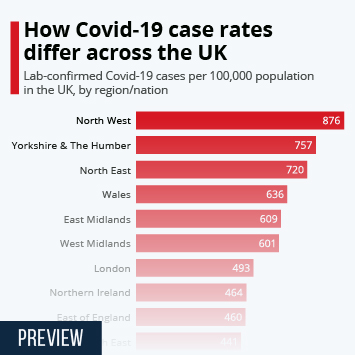
This chart shows the rate of Covid-19 cases per 100,000 population in UK regions and nations.
More Information
Economy
Sep 16, 2020
This chart shows projected changes to GDP in 2020 in selected countries.
More Information
Economy
Sep 15, 2020
This chart shows the number of redundancies in the UK from 2005 to 2020.
More Information
Global economy
Sep 14, 2020
This chart shows the percent growth from the previous month in GDP for 2020 for the U.K. and Norway.
More Information
Brexit
Sep 8, 2020
This chart presents British attitudes towards a no-deal Brexit.
More Information
Covid-19 Outbreak
Sep 3, 2020
This chart shows the countries with the highest number of health worker deaths from Covid-19.
More Information
Empires
Sep 2, 2020
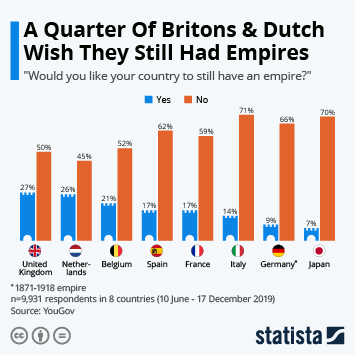
This chart shows responses to the question: "would you like your country to still have an empire?"
More Information
United Kingdom
Sep 2, 2020
This chart shows the value of claims made by companies under the UK's job retention scheme (in billion GBP).
More Information
Economy
Sep 1, 2020
This chart presents figures related to the UK's Eat Out to Help Out Scheme.
More Information
Covid-19 Outbreak
Aug 31, 2020
This chart shows the share saying their country has done a bad/good job dealing with the coronavirus outbreak.
More Information
Environment
Aug 24, 2020
This chart shows the amount of ice lost globally between 1994 and 2017 (in trillion tonnes).
More Information
Covid-19
Aug 21, 2020
This chart shows the countries and territories for which non-essential travel is advised against for people in the UK.
More Information
Health
Aug 20, 2020
This chart shows deaths caused by melanoma skin cancer in the UK per 100,000 people in 1973 and 2017.
More Information
Great Britain
Aug 18, 2020
This chart reveals reported increases in depressive symptoms in British adults during the 2020 coronavirus pandemic.
More Information
Economy
Aug 13, 2020
This chart shows the quarterly GDP growth rate in the UK.
More Information
Exports
Aug 12, 2020
This chart shows the monthly value of South Korean pharmaceutical exports in 2019 and 2020.
More Information
Covid-19
Aug 11, 2020
This chart shows the percentage change on previous quarter of number of people in employment in the UK from 2007 to 2020.
More Information
Covid-19
Aug 7, 2020
This chart shows the share of people in the UK saying they wear a mask when in public places.
More Information
Covid-19 Outbreak
Aug 7, 2020
This chart shows the share of adults who experienced stress, anxiety or sadness that was difficult to cope with alone during the pandemic.
More Information
Nuclear Weapons
Aug 3, 2020
This chart shows the estimated yield of nuclear weapons in kilotons, TNT equivalent.
More Information
European Aerospace Industry
Jul 30, 2020
This chart shows countries that have ordered European fighter jets (as of July, 2020).
More Information
Economy
Jul 10, 2020
This chart shows the tax havens with the most artificially shifted profits from high-tax countries in 2017.
More Information
GDP
Jul 10, 2020
This chart shows the biggest economies in the world by GDP (current prices/PPP) in 2019 and their growth prospects in 2020.
More Information
Unemployment
Jul 8, 2020
This chart shows labor force unemployment in selected OECD countries in February and May of 2020.
More Information
E-Cigarettes
Jul 8, 2020
This chart shows the percent of survey respondents who (also) use e-cigarettes or vapes, per country. (2020)
More Information
Europe
Jul 7, 2020
This chart shows the number of UK citizens acquiring German citizenship from 2000 to 2019.
More Information
Start-ups
Jul 6, 2020
This chart shows in which countries the world's 'unicorns' are, as of June 2020.
More Information
Auto Industry
Jul 6, 2020
This chart compares new car registrations in the United Kingdom as of June 2019 and 2020.
More Information
Life Expectancy
Jul 2, 2020
This chart shows average life expectancy at birth in selected rich nations by 2030 (in years).
More Information
Covid-19
Jul 1, 2020
This chart shows the results of a survey on how Brits feel about the pubs being closed due to Covid-19.
More Information
Coronavirus
Jun 29, 2020
This chart shows figures related to daily Covid-19 deaths as reported by the UK government.
More Information
Asset Management
Jun 29, 2020
This chart shows the countries which are the domiciles of the highest shares of global investment fund assets (as of Q1 2020).
More Information
COVID-19
Jun 26, 2020
This chart shows the net share of respondents who said they consumed the specific drugs on more days than usual during the COVID-19...
More Information
Covid-19
Jun 22, 2020
This chart shows the share of UK respondents likely to avoid the following for a while even after Covid-19 restrictions are lifted.
More Information
Juneteenth
Jun 19, 2020
This chart shows the countries most active in the trans-Atlantic slave trade.
More Information
COVID-19 Lockdowns
Jun 18, 2020
This chart compares COVID-19 containment responses in selected countries according to the University of Oxford Coronavirus Government...
More Information
United Kingdom
Jun 16, 2020
This chart presents figures related to free school meals in England and a potential summer extension.
More Information
Economy
Jun 16, 2020
This chart shows the number of claimants of UK unemployment benefits from January 2008 to May 2020.
More Information
Nuclear Weapons
Jun 15, 2020
This chart shows the number of nuclear warheads by country in 2020.
More Information
Coronavirus
Jun 15, 2020
This chart shows the country of origin of Covid-19 importation events in the UK.
More Information
Employment
Jun 9, 2020
This chart shows the time period in which UK employers think the hiring situation will return to pre-Covid-19 levels in the country.
More Information
10
/
25
Contact
Get in touch with us. We are happy to help.
Do you still have questions?
Feel free to contact us anytime using our
contact form
or visit our
FAQ page
.
Your contact to the Infographics Newsroom
Felix Richter
Data Journalist
felix.richter@statista.com
+49 (40) 284 841 557