Skip to main content
Consumer Goods & FMCG
E-Commerce
Economy & Politics
Energy & Environment
Health, Pharma & Medtech
Internet
Media
Technology & Telecommunications
Transportation & Logistics
Travel, Tourism & Hospitality
View all industries
Global data volume growth
Global AI market size
Number of generative AI users worldwide
Global inflation rate
Retail e-commerce sales worldwide
Largest economies worldwide
Biggest social media platforms by users
Global EV market share by manufacturer
International tourist arrivals by world region
Global annual CO₂ emissions
Browse recent statistics
Artificial intelligence (AI) worldwide
TikTok
Nvidia
E-commerce worldwide
Global GDP
Instagram
Apparel market worldwide
Video gaming worldwide
Global renewable energy industry
Influencer marketing worldwide
Browse recent topics
Consumer Trends 2026
Artificial Intelligence: in-depth market analysis
E-commerce challenges
Global economy
TikTok
Luxury goods: in-depth market analysis
Electric vehicles: A global overview
Video gaming worldwide
Travel and tourism trends 2026
Battery recycling worldwide
Browse recent reports
Explore the tool
Explore Classic mode
Advertising & Media
eCommerce
Consumer
Finance
Global Indicators
Health
Industrial
Mobility
Technology
Explore Market Insights
eCommerce Insights
Research AI
Book a demo
All integrations
Developer docs
Explore Statista Connect
Research
Strategy & Consulting
Marketing
Media & PR
Explore AI assistants
Marketing
Research & Development
Strategy
Sales
Find the fact
Tell the story
Win the pitch
Understand the market
Develop your strategy
Academia
Agencies
Consultancies
Consumer goods
Finance
Tech
Research solutions
Strategy consulting
Communication services
Explore Statista+
Statista R
Statista Healthcare
About Statista
First steps & help center
Webinar & training hub
Success stories
Individuals & Small Teams
Businesses & Enterprises
Academia & Government
English
Deutsch
Daily Data
Infographics on the topic "uk"
U.S. Military
Jun 8, 2020
This chart shows the countries hosting the most active-duty U.S. troops deployed overseas.
More Information
Coronavirus
Jun 8, 2020
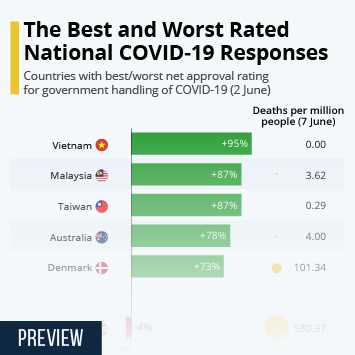
This chart shows the countries with best/worst net approval rating for the government handling of COVID-19 with deaths per million...
More Information
Hong Kong
Jun 4, 2020
This charts shows stats related to the British National Overseas passport for Hong Kong citizens and the proposed extension of the...
More Information
COVID-19 Outbreak
May 29, 2020
This chart shows the estimated share of the population with COVID-19 antibodies.
More Information
Tampon Tax
May 28, 2020
This chart shows sales tax on feminine hygiene products in selected countries in 2020.
More Information
United Kingdom
May 27, 2020
This chart shows public opinion on Dominic Cummings' alleged breach of UK lockdown rules.
More Information
United Kingdom
May 27, 2020
This chart shows voting intention in the UK in the wake of the Dominic Cummings scandal.
More Information
COVID-19 Outbreak
May 20, 2020
This chart shows the share who trust what the media says about COVID-19 in selected countries (5-13 May, 2020).
More Information
Tourism
May 18, 2020
This chart shows the most visited historical and cultural monuments in the World in 2018.
More Information
COVID-19 Outbreak
May 15, 2020
This chart shows the percentage of trips that were domestic or abroad in selected EU countries in 2017.
More Information
Motorsport
May 12, 2020
This chart shows the circuits which have hosted the most Formula One Grand Prix (1950-2019).
More Information
Coronavirus
May 12, 2020
This chart shows the daily number of Covid-19 tests conducted in the UK.
More Information
COVID-19 Outbreak
May 11, 2020
This chart shows the share saying the UK government handled things better/worse than the following countries.
More Information
Single Parents
May 8, 2020
This chart shows the share of children under the age of 18 living with single parents around the world in 2018.
More Information
COVID-19 Outbreak
May 7, 2020
This chart shows the Spring 2020 GDP growth forecast for the EU.
More Information
Coronavirus
May 6, 2020
This chart shows the European countries with the most Covid-19 associated deaths.
More Information
Air Pollution
May 4, 2020
This chart shows the estimated number of premature deaths avoided due to lower air pollutant exposure.
More Information
Health
Apr 29, 2020
This chart shows the estimated additional cancer deaths in England over the next 12 months due to the Covid-19 emergency.
More Information
Coronavirus Crisis
Apr 29, 2020
This chart shows the countries/territories where food imports account for largest share of total merchandise imports.
More Information
COVID-19 Outbreak
Apr 28, 2020
This chart shows reported COVID-19 deaths as a share of total U.S. excess deaths (March 01 through April 04).
More Information
United Kingdom
Apr 27, 2020
This chart present the results of a survey of GPs in the UK on the subject of PPE and the coronavirus crisis.
More Information
COVID-19 Lockdowns
Apr 23, 2020
This chart shows enforced COVID-19 lockdowns in different countries by the size of the population affected (2020).
More Information
Coronavirus
Apr 23, 2020
This chart compares the share of the total population and the share of Covid-19 deaths in England, by ethnicity.
More Information
Coronavirus
Apr 22, 2020
This chart shows the number of people tested for Covid-19 in the UK in the 24 hours up to 9am of each day.
More Information
COVID-19
Apr 21, 2020
This chart shows the share of people per country who said they had worn a face mask because of the COVID-19 pandemic (as of April 12,...
More Information
Covid-19
Apr 21, 2020
this chart shows pence per litre changes to UK fuel prices in 2020 compared to the same week of 2019.
More Information
COVID-19
Apr 21, 2020
This chart shows the share of doctors who prescribed hydroxychloroquine for COVID-19 in selected countries (as of April 9, 2020).
More Information
Environmental impact of COVID-19
Apr 20, 2020
This chart shows the change in the concentration if NO2 in the air in selected major cities in April 2019 and 2020.
More Information
E-commerce
Apr 20, 2020
This chart shows the countries which spend the most on groceries online in H1 of 2019.
More Information
Coronavirus
Apr 7, 2020
This chart shows the critical care unit outcomes for Covid-19 patients in the UK.
More Information
Covid-19
Apr 6, 2020
This chart shows the change in movements in New York after the coronavirus lockdown as recorded by Google location data, by category.
More Information
COVID-19 Outbreak
Mar 31, 2020
This chart shows the estimated number of averted deaths due to COVID-19 intervention (up to Mar 31).
More Information
Coronavirus
Mar 27, 2020
This chart shows Google Search interest in the United Kingdom for 'how to cut own hair' in March 2020.
More Information
COVID-19
Mar 26, 2020
This chart shows the net favourability of selected UK politicians in March 2020.
More Information
Coronavirus in the UK
Mar 25, 2020
This chart shows the average gross annual earnings of selected 'key' jobs in the United Kingdom.
More Information
COVID-19
Mar 24, 2020
This chart shows the share in Great Britain that think certain economic areas will be impacted by a widespread coronavirus outbreak.
More Information
Sport
Mar 20, 2020
This chart shows the matches of 19-20 season left to play in major European football leagues.
More Information
Transport
Mar 10, 2020
This chart shows the UK cities where the average commuter spent the most hours in congestion in 2019.
More Information
Friday the 13th
Mar 10, 2020
This chart shows the percentage of U.S. adults who said they are superstitious.
More Information
Clothing expenses
Mar 9, 2020
This chart shows the consumer spending on clothing in Europe in 2018.
More Information
Women's Day
Mar 6, 2020
This chart shows the percentage of people in different countries agreeing that equal rights for men and women have been achieved.
More Information
COVID-19
Mar 4, 2020
This chart shows the most common measures taken by people in Great Britain to protect from the coronavirus specifically.
More Information
Brexit Trade Deal
Mar 3, 2020
This chart shows the 10-year cumulative impact on GDP under different Brexit scenarios.
More Information
Drug Busts
Feb 28, 2020
This chart shows the share different drugs had of total customs drug seizures (by weight) in the U.S. and the UK in 2018/19.
More Information
United Kingdom
Feb 24, 2020
This chart shows the number of smartphones, laptops and tablets stolen/lost by government department (June 2018-June 2019)
More Information
Environment
Feb 20, 2020
This chart shows environmental taxes as a share of total taxes & social contributions in 2018.
More Information
Brexit
Feb 19, 2020
This chart shows the percentage of workers in the UK who came from EU countries in 2017.
More Information
Power Dynamics
Feb 17, 2020
This chart shows survey responses in selected countries towards to whether the U.S. or China are seen as the world's leading economic...
More Information
Survey
Feb 14, 2020
This chart shows which housework tasks are most often solely done by men or by women in UK households.
More Information
Elections
Feb 13, 2020
This chart shows the percentage of adults confident in the honesty of elections in selected countries
More Information
Global Consumer Survey
Feb 13, 2020
This chart shows the share of UK smartphone users that regularly use dating apps, by relationship status in 2019.
More Information
Rising Sea Levels
Feb 11, 2020
This chart shows the number of people per country affected by rising sea levels by 2100.
More Information
Handedness
Feb 4, 2020
This chart shows the rate of left-handedness in selected countries.
More Information
United Kingdom
Feb 4, 2020
This chart shows the share bothered by hearing a non-English conversation among foreigners.
More Information
Brexit
Feb 3, 2020
This chart shows the distribution of UK European Parliament seats by Member
More Information
Brexit Day
Jan 31, 2020
This chart shows the United Kingdom's share of selected components of the European Union.
More Information
Huawei
Jan 30, 2020
This chart shows countries that have banned Huawei products or are planning to do so (as of Aug 19, 2019).
More Information
Traffic Congestion
Jan 30, 2020
This chart shows the percentage of extra travel time due to congestion in 2019.
More Information
Employment
Jan 21, 2020
This chart shows the industries/sectors in the UK with the highest median graduate starting salaries in 2020.
More Information
UK Politics
Jan 21, 2020
This chart shows a simulated Labour leadership contest according to Labour members' order of preference in January 2020.
More Information
Data Breaches
Jan 21, 2020
This chart shows personal data breaches notified per EEA jurisdiction.
More Information
Employment
Jan 20, 2020
This chart shows the industries/sectors in the UK with the most planned graduate vacancies in 2020.
More Information
Brexit
Jan 20, 2020
This chart shows cumulative UK real GDP losses due to Brexit by year.
More Information
World Economic Forum
Jan 20, 2020
This chart shows the countries with the most attendees at the World Economic Forum 2020.
More Information
Brexit
Jan 20, 2020
This chart shows the forecast cost of Brexit compared to the UK's EU budget contributions.
More Information
Royal Family
Jan 20, 2020
This chart shows the share of headlines about Kate & Meghan that were positive/negative (May '18-Jan '19).
More Information
Demographics
Jan 17, 2020
This chart shows the number of death registrations in the United Kingdom from 1974 to 2018.
More Information
Term Limits
Jan 16, 2020
This chart shows the term limits of selected heads of government around the world.
More Information
Soccer
Jan 14, 2020
This chart shows the football clubs with the most revenue in 2018/19.
More Information
Royal Family
Jan 13, 2020
This chart shows the share of UK adults who support/oppose the move.
More Information
Ghosn
Jan 9, 2020
This chart provides an overview of the Carlos Ghosn Case.
More Information
Royal Family
Jan 9, 2020
This chart shows the share of the UK public feeling the following is treated least favourably by the media.
More Information
UK Politics
Jan 3, 2020
This chart shows who Labour party members say would be their first choice leadership candidate in December 2019.
More Information
2020
Jan 2, 2020
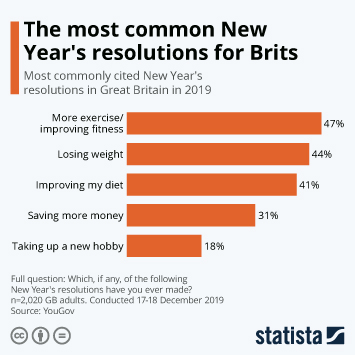
This chart shows the most commonly cited New Year's resolutions in Great Britain.
More Information
Star Wars
Dec 20, 2019
This chart shows how U.K. fans answered when asked, which one do you think is the best hero from the Star Wars films?
More Information
U.S. Treasuries
Dec 18, 2019
This chart shows the most common countries among foreign holders of U.S. treasuries in Oct 2018 and 2019.
More Information
UK General Election
Dec 18, 2019
This chart shows 2019 general election voting for selected parties by age.
More Information
UL Politics
Dec 13, 2019
This chart shows the Conservative general election majority in Uxbridge and South Ruislip from 2010 to 2019.
More Information
UK Election
Dec 13, 2019
This chart shows general election voter turnout in the UK from 1997 to 2019.
More Information
United Kingdom
Dec 13, 2019
This chart shows the share of vote received by main party leaders in 2019 general election and change on 2017.
More Information
Dec 13, 2019
This chart shows the Scottish seats won in the 2019 UK general election and change on 2017 result, by party.
More Information
UK Election
Dec 13, 2019
This chart shows the seats won in the 2019 UK general election and change on 2017 result, by party.
More Information
UK Election 2019
Dec 11, 2019
This chart reveals the most common policies from the Conservative and Labour 2019 manifestos that the British public are aware of.
More Information
UK Election 2019
Dec 11, 2019
This chart compares exit polls featured by the BBC and the actual UK general election results from 2001 to 2017.
More Information
UK Election 2019
Dec 11, 2019
This infographic shows a comparison of exit poll seat predictions for the winning party and the actual UK general election results...
More Information
UK Politics
Dec 11, 2019
This chart shows the projected seats won in the 2019 UK general election, by party.
More Information
Public Health Services
Dec 10, 2019
This chart shows the annual average real growth rates in UK public spending on health, by government/period from 1949 to 2017.
More Information
Politics
Dec 9, 2019
This chart shows appearances of politicians in national news coverage between 7 Nov and 4 Dec 2019.
More Information
Maritime Emissions
Dec 9, 2019
This chart shows CO2 from ships vs emissions from national car fleets in 2019 (million tons).
More Information
Brexit
Dec 9, 2019
This chart shows how EU citizens living in the UK would vote in the 2019 general election.
More Information
11
/
25
Contact
Get in touch with us. We are happy to help.
Do you still have questions?
Feel free to contact us anytime using our
contact form
or visit our
FAQ page
.
Your contact to the Infographics Newsroom
Felix Richter
Data Journalist
felix.richter@statista.com
+49 (40) 284 841 557