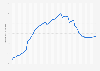
Goods from China were the most selling product category on Telegram in 2020, followed by digital equipment and consumer loans. In total, the e-commerce of goods from China via the social media platform exceeded 12 million U.S. dollars.
Sales volume on Telegram worldwide in 2020, by segment (in 1,000 U.S. dollars)
Basic Account
Get to know the platform
You only have access to basic statistics.
This statistic is not included in your account.
Starter Account
The ideal entry-level account for individual users
- Instant access to 1m statistics
- Download in XLS, PDF & PNG format
- Detailed references
$199 USD / Month *
Professional Account
Full access
Business Solutions including all features.
* Prices do not include sales tax.
Other statistics that may interest you Online marketplaces
Overview
6
- Basic Statistic Leading large cap e-commerce companies worldwide 2023, by market cap
- Basic Statistic Leading online marketplaces worldwide 2021-2023, by revenue CAGR
- Premium Statistic Leading global online marketplaces 2022, by GMV
- Premium Statistic Leading online marketplaces worldwide 2023, by monthly visits
- Premium Statistic Leading online marketplaces worldwide 2023, by visit share
- Premium Statistic Most downloaded marketplace apps worldwide 2023
Key markets
8
- Premium Statistic Leading U.S. online marketplaces 2022, by GMV
- Premium Statistic Leading online marketplaces in the U.S. 2023, by monthly visits
- Premium Statistic Unique visitors to Amazon, Temu, Shein, and AliExpress in the U.S. 2022-2023
- Premium Statistic Leading online marketplaces in Europe 2023, by monthly visits
- Premium Statistic Leading online marketplaces in the UK 2023, by monthly visits
- Premium Statistic Leading online marketplaces in Germany 2023, by visit share
- Premium Statistic Leading online marketplaces in China 2023, by monthly visits
- Premium Statistic Leading online marketplaces in Latin America 2023, by monthly visits
Amazon Marketplace
7
- Premium Statistic Amazon quarterly net sales revenue 2007-2023
- Premium Statistic Quarterly value of Amazon third-party seller services 2017-2023
- Premium Statistic Amazon marketplace gross merchandise volume 2022, by top domains
- Premium Statistic Amazon third-party seller share 2007-2023
- Premium Statistic Main Amazon product categories for small and medium-sized business (SMB) sellers 2022
- Premium Statistic Amazon seller usage of other marketplaces 2022
- Premium Statistic Monthly visits to Amazon Marketplaces 2023, by country web domain
eBay
6
- Basic Statistic eBay: quarterly net revenue 2014-2023
- Premium Statistic eBay: annual net revenue 2013-2022, by region
- Premium Statistic eBay: annual net income 2004-2022
- Basic Statistic eBay: gross merchandise volume 2007-2022
- Premium Statistic eBay: quarterly active buyers worldwide 2010-2023
- Premium Statistic eBay: global ad spend 2014-2022
Etsy
6
- Basic Statistic Etsy: annual revenue 2012-2022, by segment
- Basic Statistic Etsy: annual gross merchandise sales 2005-2022
- Basic Statistic Etsy: mobile share of gross merchandise sales 2013-2022
- Basic Statistic Etsy: number of active buyers 2012-2022
- Premium Statistic Etsy: number of active sellers 2012-2022
- Basic Statistic Etsy: self-identification of sellers 2022
Further related statistics
16
- Russia: smart home assisted e-shopping share 2017-2018, by frequency
- Furniture and appliances e-commerce revenue worldwide from 2018-2022
- Online food and groceries shoppers in Norway 2013-2021, by gender
- Gender distribution of DBA marketplace users in Denmark 2021
- Latin America: popular online shopping categories 2018
- Leading e-commerce websites in Italy 2021, by popularity score
- Proportion of online and offline child safety seat sales in China 2017
- Online shopping device usage in Ecuador 2021
- Share of people buying online tickets for sports events in Finland 2020, by age group
- Share of regular e-shoppers purchasing fashion goods online in Italy 2023
- YoY change in container shipping volumes worldwide by route 2019-2020
- Leading importers of woven fabrics of man-made textile materials worldwide in 2022
- Symbols of success for business travelers worldwide as of February 2014
- Value of positron emission mammography research and analysis 2019-2026, by region
- U.S. graphite electrode import value 2019, by country
- Global revenue of the legal services industry by country and region 2015
Further Content: You might find this interesting as well
Statistics
- Russia: smart home assisted e-shopping share 2017-2018, by frequency
- Furniture and appliances e-commerce revenue worldwide from 2018-2022
- Online food and groceries shoppers in Norway 2013-2021, by gender
- Gender distribution of DBA marketplace users in Denmark 2021
- Latin America: popular online shopping categories 2018
- Leading e-commerce websites in Italy 2021, by popularity score
- Proportion of online and offline child safety seat sales in China 2017
- Online shopping device usage in Ecuador 2021
- Share of people buying online tickets for sports events in Finland 2020, by age group
- Share of regular e-shoppers purchasing fashion goods online in Italy 2023
- YoY change in container shipping volumes worldwide by route 2019-2020
- Leading importers of woven fabrics of man-made textile materials worldwide in 2022
- Symbols of success for business travelers worldwide as of February 2014
- Value of positron emission mammography research and analysis 2019-2026, by region
- U.S. graphite electrode import value 2019, by country
- Global revenue of the legal services industry by country and region 2015
Admitad. (February 1, 2021). Sales volume on Telegram worldwide in 2020, by segment (in 1,000 U.S. dollars) [Graph]. In Statista. Retrieved April 23, 2024, from https://www.statista.com/statistics/1222078/sales-of-products-on-telegram-by-category/
Admitad. "Sales volume on Telegram worldwide in 2020, by segment (in 1,000 U.S. dollars)." Chart. February 1, 2021. Statista. Accessed April 23, 2024. https://www.statista.com/statistics/1222078/sales-of-products-on-telegram-by-category/
Admitad. (2021). Sales volume on Telegram worldwide in 2020, by segment (in 1,000 U.S. dollars). Statista. Statista Inc.. Accessed: April 23, 2024. https://www.statista.com/statistics/1222078/sales-of-products-on-telegram-by-category/
Admitad. "Sales Volume on Telegram Worldwide in 2020, by Segment (in 1,000 U.S. Dollars)." Statista, Statista Inc., 1 Feb 2021, https://www.statista.com/statistics/1222078/sales-of-products-on-telegram-by-category/
Admitad, Sales volume on Telegram worldwide in 2020, by segment (in 1,000 U.S. dollars) Statista, https://www.statista.com/statistics/1222078/sales-of-products-on-telegram-by-category/ (last visited April 23, 2024)
Sales volume on Telegram worldwide in 2020, by segment (in 1,000 U.S. dollars) [Graph], Admitad, February 1, 2021. [Online]. Available: https://www.statista.com/statistics/1222078/sales-of-products-on-telegram-by-category/