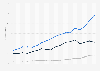
In the financial year ended March 31, 2024, Under Armour generated around 3.79 billion U.S. dollars from apparel sales. The company had global net sales of approximately 5.7 billion U.S. dollars that year.
Under Armour's apparel sales worldwide from 2013 to 2024
(in million U.S. dollars)
* Financial years up until 2021 began on January 1 and ended December 31. After 2021, Under Armour went through a transitional period and from 2022 on, fiscal years begin April 1 and end March 31 (for instance "Fiscal 2022" refers to the fiscal year beginning on April 1, 2021 and ended March 31, 2022). For this reason, overlaps between the fiscal years of 2021 and 2022 are to be expected.
Profit from the additional features of your individual account
Currently, you are using a shared account. To use individual functions (e.g., mark statistics as favourites, set
statistic alerts) please log in with your personal account.
If you are an admin, please authenticate by logging in again.
Learn more about how Statista can support your business.
Under Armour. (May 29, 2024). Under Armour's apparel sales worldwide from 2013 to 2024 (in million U.S. dollars) [Graph]. In Statista. Retrieved July 27, 2024, from https://www.statista.com/statistics/246511/under-armour-apparel-sales-worldwide/
Under Armour. "Under Armour's apparel sales worldwide from 2013 to 2024 (in million U.S. dollars)." Chart. May 29, 2024. Statista. Accessed July 27, 2024. https://www.statista.com/statistics/246511/under-armour-apparel-sales-worldwide/
Under Armour. (2024). Under Armour's apparel sales worldwide from 2013 to 2024 (in million U.S. dollars). Statista. Statista Inc.. Accessed: July 27, 2024. https://www.statista.com/statistics/246511/under-armour-apparel-sales-worldwide/
Under Armour. "Under Armour's Apparel Sales Worldwide from 2013 to 2024 (in Million U.S. Dollars)." Statista, Statista Inc., 29 May 2024, https://www.statista.com/statistics/246511/under-armour-apparel-sales-worldwide/
Under Armour, Under Armour's apparel sales worldwide from 2013 to 2024 (in million U.S. dollars) Statista, https://www.statista.com/statistics/246511/under-armour-apparel-sales-worldwide/ (last visited July 27, 2024)
Under Armour's apparel sales worldwide from 2013 to 2024 (in million U.S. dollars) [Graph], Under Armour, May 29, 2024. [Online]. Available: https://www.statista.com/statistics/246511/under-armour-apparel-sales-worldwide/