This statistic shows the number of consumer packaged goods coupons distributed throughout the United States from 2004 to 2014. In 2013, the total number of 
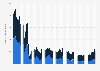
CPG coupons distributed throughout the United States was 329 billion. In that year, the total value of all coupons distributed amounted to about 513 billion U.S. dollars.
Number of consumer packaged goods coupons distributed throughout the U.S. from 2004 to 2014 (in billions)
Loading statistic...
Basic Account
Get to know the platform
You only have access to basic statistics.
Starter Account
The ideal entry-level account for individual users
- Instant access to 1m statistics
- Download in XLS, PDF & PNG format
- Detailed references
$189 USD $149 USD / Month *
in the first 12 months
Professional Account
Full access
Business Solutions including all features.
* Prices do not include sales tax.
Other statistics that may interest you Statistics on
About the industry
10
- Basic Statistic Total number of redeemed consumer packaged goods coupons in the U.S. 2007-2014
- Basic Statistic Total number of redeemed food grocery coupons in the U.S. 2007-2014
- Basic Statistic Total savings from redeemed CPG coupons in the U.S. 2008-2014
- Basic Statistic Total value of distributed consumer packaged goods coupons in the U.S. 2007-2011
- Premium Statistic Revenue of the food industry worldwide 2018-2028
- Premium Statistic Revenue growth of food worldwide 2019-2028
- Premium Statistic Number of eggs produced in Canada 2010-2022
- Premium Statistic Number of eggs produced in Canada 2022, by province
- Premium Statistic Average number of layers in Canada 2010-2022
- Premium Statistic Average number of layers in Canada 2022, by province
About the region
10
- Premium Statistic Consumer response on methods of coupon redemption in the U.S. 2016
- Premium Statistic Integrated digital solutions shoppers want to see in the U.S. 2013-2016
- Premium Statistic Millennials using mobile savings apps in the U.S. 2020, by type
- Premium Statistic Millennial paper coupon use in the United States 2020, by type
- Premium Statistic How Millennial parents find coupons for grocery shopping trips U.S. 2018
- Premium Statistic Retail volume of the tissue industry in the U.S. from 2011 to 2021, by segment
- Premium Statistic Total number of coupons distributed in the U.S. 2011-2016
- Premium Statistic Total number of coupons redeemed in the U.S. 2005-2016
- Premium Statistic Methods of coupon distribution in the U.S. 2016
- Premium Statistic Methods of coupon redemption in the U.S. 2016
Selected statistics
3
Other regions
9
- Premium Statistic Convenience store market size in South Korea 2015-2022
- Premium Statistic E-Land Group's fashion retail sales revenue in China 2014-2016
- Premium Statistic Coupon use for grocery shopping in the United Kingdom (UK) 2014-2016
- Premium Statistic Sales distribution of fruit juice in Spain 2014, by sales channel
- Premium Statistic Ice cream and sorbet sales growth in South Africa in 2015, by distribution channel
- Premium Statistic Pet food retail market share of grocery retailers in Japan 2013-2017
- Premium Statistic Retail sales of the global direct selling industry in Malaysia 2013-2020
- Premium Statistic Chile: change in retail sales 2019, by subsector
- Premium Statistic Latin America: Danone popularity 2019, by country
Related statistics
10
- Premium Statistic Number of Alnatura stores in Germany 2006/07-2022/23
- Premium Statistic Most popular FMCG brands worldwide 2022
- Premium Statistic Revenue of the pet food market worldwide by country 2022
- Basic Statistic PetSmart's revenue in the U.S. 2016/17-2021/22
- Premium Statistic Net sales of General Mills worldwide by segment 2022
- Basic Statistic Leading FMCG brands' household penetration in the United Kingdom (UK) 2021
- Basic Statistic Leading FMCG brands ranked by frequency purchased in the United Kingdom (UK) 2021
- Basic Statistic Food retail sales volume percentage change in Great Britain 2012-2021
- Premium Statistic FMCG categories with biggest promotional change during the pandemic UK 2020
- Premium Statistic FMCG categories with biggest promotional change during the pandemic U.S. 2020
Further related statistics
10
- Mondelez International's net revenue distribution worldwide by sector 2022
- Mondelez International's operating income worldwide 2011-2022
- Mondelez International's global workforce by region 2012-2022
- Net income of Church & Dwight worldwide 2009-2022
- Secondhand goods: Sales volume percentage change in Great Britain (UK) 2013-2022
- Walgreens gross profit and net earnings in the U.S. 2005-2022
- Walgreens operating income in the U.S. 2005-2022
- Global advertising costs of The Clorox Company 2011-2023
- Mail order retail: Sales volume percentage change in Great Britain (UK) 2011-2020
- Alcohol and tobacco sales volume percentage increase in Great Britain (UK) 2011-2019
Further Content: You might find this interesting as well
Statistics
- Mondelez International's net revenue distribution worldwide by sector 2022
- Mondelez International's operating income worldwide 2011-2022
- Mondelez International's global workforce by region 2012-2022
- Net income of Church & Dwight worldwide 2009-2022
- Secondhand goods: Sales volume percentage change in Great Britain (UK) 2013-2022
- Walgreens gross profit and net earnings in the U.S. 2005-2022
- Walgreens operating income in the U.S. 2005-2022
- Global advertising costs of The Clorox Company 2011-2023
- Mail order retail: Sales volume percentage change in Great Britain (UK) 2011-2020
- Alcohol and tobacco sales volume percentage increase in Great Britain (UK) 2011-2019
Inmar. (February 25, 2015). Number of consumer packaged goods coupons distributed throughout the U.S. from 2004 to 2014 (in billions) [Graph]. In Statista. Retrieved September 22, 2023, from https://www.statista.com/statistics/285770/cpg-coupons-distributed-throughout-the-us-2004-2012/
Inmar. "Number of consumer packaged goods coupons distributed throughout the U.S. from 2004 to 2014 (in billions)." Chart. February 25, 2015. Statista. Accessed September 22, 2023. https://www.statista.com/statistics/285770/cpg-coupons-distributed-throughout-the-us-2004-2012/
Inmar. (2015). Number of consumer packaged goods coupons distributed throughout the U.S. from 2004 to 2014 (in billions). Statista. Statista Inc.. Accessed: September 22, 2023. https://www.statista.com/statistics/285770/cpg-coupons-distributed-throughout-the-us-2004-2012/
Inmar. "Number of Consumer Packaged Goods Coupons Distributed throughout The U.S. from 2004 to 2014 (in Billions)." Statista, Statista Inc., 25 Feb 2015, https://www.statista.com/statistics/285770/cpg-coupons-distributed-throughout-the-us-2004-2012/
Inmar, Number of consumer packaged goods coupons distributed throughout the U.S. from 2004 to 2014 (in billions) Statista, https://www.statista.com/statistics/285770/cpg-coupons-distributed-throughout-the-us-2004-2012/ (last visited September 22, 2023)
Number of consumer packaged goods coupons distributed throughout the U.S. from 2004 to 2014 (in billions) [Graph], Inmar, February 25, 2015. [Online]. Available: https://www.statista.com/statistics/285770/cpg-coupons-distributed-throughout-the-us-2004-2012/