L. Yltävä
Research expert

Groupon: global revenue 2008-2023
Global revenue of Groupon from 2008 to 2023 (in million U.S. dollars)

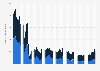
Groupon: quarterly revenue 2009-2024
Revenue of Groupon from 2nd quarter 2009 to 1st quarter 2024 (in million U.S. dollars)

Groupon: annual revenue in North America 2009-2023
Groupon's revenue in North America from 2009 to 2023 (in million U.S. dollars)

Number of Groupon active customers 2009-2024
Number of Groupon's active customers from 2nd quarter 2009 to 1st quarter 2024 (in millions)

Groupon market cap development 2011-2024
Market capitalization of Groupon from 2011 to 2024 (in billion U.S. dollars)

Groupon: annual net income/loss 2009-2023
Annual net income/loss of Groupon from 2009 to 2023 (in million U.S. dollars)

Groupon: quarterly net income/loss 2015-2024
Groupon's net income/loss from 1st quarter 2015 to 1st quarter 2024 (in million U.S. dollars)

Groupon: quarterly gross billings 2014-2024, by category
Groupon's consolidated gross billings from 1st quarter 2014 to 1st quarter 2024, by category (in million U.S. dollars)

Groupon: marketing expense 2013-2023
Marketing expense of Groupon from 2013 to 2023 (in million U.S. dollars)

Groupon: operating expenses 2008-2023
Operating expenses of Groupon from 2008 to 2023 (in million U.S. dollars)

Groupon: global sales force 2009-2024
Number of Groupon's merchant sales representatives and sales support staff from 1st quarter 2009 to 1st quarter 2024

Leading coupons and rebates websites worldwide 2023, based on visit share
Most popular coupons and rebates websites worldwide in December 2023, based on share of visits

Leading coupons and rebates websites in the U.S. 2023, based on visit share
Most popular coupons and rebates websites in the United States in December 2023, based on share of visits

Leading coupons and rebates websites in the UK 2023, based on visit share
Most popular coupons and rebates websites in the United Kingdom in December 2023, based on share of visits

Leading discount and offer apps worldwide 2023, by downloads
Most popular free discount and offer apps worldwide in 2023, by number of downloads (in millions)

Leading discount and offer apps in the U.S. 2023, by downloads
Most popular free discount and offer apps in the United States in 2023, by number of downloads (in millions)

Most downloaded discounts and offers apps in Canada 2023
Leading discounts and offers apps in Canada in 2023, by number of downloads (in 1,000s)

Most downloaded discount apps in the UK 2023
Leading discount and offer apps in the United Kingdom (UK) in 2023, by number of downloads (in millions)

Groupon.com: key figures 2024
Key figures on Groupon.com as of May 2024

Total global visitor traffic to Groupon.com 2024
Worldwide visits to Groupon.com from March to May 2024 (in millions)

Groupon.com: website traffic share in the U.S. 2024, by device
Distribution of Groupon.com visits in the United States in May 2024, by device

Groupon.ca: website traffic share in Canada 2024, by device
Distribution of Groupon.ca visits in Canada in May 2024, by device

Groupon.co.uk: website traffic share in the UK 2024, by device
Distribution of Groupon.co.uk visits in the United Kingdom (UK) in May 2024, by device

Groupon.es: website traffic share in Spain 2024, by device
Distribution of Groupon.es visits in Spain in May 2024, by device
Groupon app monthly downloads worldwide 2019-2024, by operating system
Number of monthly downloads of the Groupon app worldwide from January 2019 to May 2024, by operating system (in 1,000s)

Groupon: app downloads share worldwide 2024, by country
Share of Groupon app downloads worldwide as of June 2024, by country

Countries with most Groupon app downloads 2023
Countries with the highest number of Groupon app downloads in 2023 (in 1,000s)

Monthly number of Groupon app downloads in the U.S. 2015-2024
Number of Groupon app downloads in the United States from January 2015 to May 2024


Mon - Fri, 9am - 6pm (EST)
Mon - Fri, 9am - 5pm (SGT)
Mon - Fri, 10:00am - 6:00pm (JST)
Mon - Fri, 9:30am - 5pm (GMT)
Mon - Fri, 9am - 6pm (EST)


