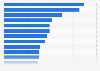
This statistic presents the percentage of global internet users who use online reviews for product research as of the third quarter 2017, by age group. During the survey period, it was found that 31 percent of respondents aged 16 to 24 years had used a customer review to research products online.
Percentage of global internet users who use online reviews for brand and product research as of 3rd quarter 2017, by age group
Basic Account
Get to know the platform
You only have access to basic statistics.
This statistic is not included in your account.
Starter Account
The ideal entry-level account for individual users
- Instant access to 1m statistics
- Download in XLS, PDF & PNG format
- Detailed references
$59 USD $39 USD / Month *
in the first 12 months
Professional Account
Full access
Business Solutions including all features.
* Prices do not include sales tax.
Statistics on User-generated content
Overview
8
- Basic Statistic Media usage in an online minute 2022
- Premium Statistic Leading mobile-first online activities worldwide 2019
- Premium Statistic Activities on laptop/ detachable/ convertible in the U.S. 2018
- Premium Statistic Activities on PC in the U.S. 2018
- Premium Statistic Tablet usage/activities United States 2022
- Premium Statistic Most used social media platforms by type in the U.S. 2022
- Premium Statistic Most common social media activities in the U.S. 2022
- Basic Statistic U.S. weekly social media content posting 2019, by platform
Video
8
- Premium Statistic Hours of video uploaded to YouTube every minute 2007-2022
- Basic Statistic Most popular YouTube content categories 2018, by uploads
- Basic Statistic Most popular YouTube content categories 2018, by views
- Basic Statistic Average YouTube video length 2018, by category
- Premium Statistic Frequency of U.S. adults vlogging 2018
- Premium Statistic Frequency of U.S. viewers watching vlogs on social media 2018, by type
- Premium Statistic Frequency of U.S. adults watching vloggers on social media 2018
- Premium Statistic Frequency of U.S. adults watching vloggers on social media 2018, by gender
Gaming video content (GVC)
8
- Premium Statistic YouTube: most subscribed gaming channels 2022
- Premium Statistic Games reviewed gaming influencers on YouTube worldwide 2018
- Premium Statistic Gaming video content revenue worldwide 2016-2020
- Premium Statistic Gaming video content platforms revenue worldwide 2018
- Premium Statistic Time spent watching GVC in the U.S. in 2019, by age
- Premium Statistic Frequency of watching GVC in the U.S. 2019, by age
- Premium Statistic Average donations to gaming video content in the U.S. 2019, by age
- Premium Statistic Number of minutes spent watching Twitch content worldwide 2012-2022
Photos and selfies
8
- Basic Statistic Instagram accounts with the most followers worldwide 2023
- Basic Statistic Number of monthly active Instagram users 2013-2021
- Basic Statistic Daily active users of Instagram Stories 2019
- Basic Statistic Instagram: distribution of global audiences 2023, by age and gender
- Basic Statistic Instagram: most popular posts as of 2022
- Basic Statistic Most instagrammed tourist attractions worldwide 2018
- Basic Statistic Daily active users of Snapchat 2014-2022
- Basic Statistic Snapchat usage frequency in the United States 2020
Online reviews
8
- Premium Statistic Common ways online shoppers worldwide research unfamiliar digital retailers 2019
- Premium Statistic Sources of inspiration for new products in the U.S. 2022
- Premium Statistic Sources of information about products in the U.S. 2022
- Premium Statistic Attitudes towards online shopping in the U.S. 2022
- Premium Statistic Important characteristics of online shops for U.S. consumers 2018
- Basic Statistic Key factors for U.S. users to shop via Amazon 2020
- Premium Statistic U.S. Amazon shopper product review trust 2020
- Basic Statistic Number of online product reviews expected by U.S. digital shoppers 2019, by age
Further related statistics
16
- U.S. consumers most important aspects of online business reviews 2021
- UGC content impact on online shoppers in the U.S. 2017
- Reasons why U.S. internet users might not trust an online review 2012
- U.S. online shoppers who have posted online reviews 2017, by gender
- Reasons for U.S. internet users to leave online reviews 2017
- Reasons for using social media after a holiday in the United Kingdom (UK) 2015-2016
- Influence of travel review sites on U.S. leisure travelers in 2012, by age
- Online users influenced by reading social media 2018, by country
- U.S. consumer concerns about the authenticity of online reviews 2015
- Luxury hotel online review distribution 2014, by author region
- U.S. shopper star-rating expectation to buy from a retailer 2019, by vertical
- Types of travel purchases influenced by travel review sites in the U.S. 2015
- Importance of guest reviews online to U.S. leisure travelers booking hotels 2017
- Level of influence travel review sites have on travel choices in the U.S. 2014-2015
- Importance of guest reviews online to U.S. business travelers booking hotels 2017
- Importance of reviews/comments to U.S. consumers when choosing clothes 2017
Further Content: You might find this interesting as well
Statistics
- U.S. consumers most important aspects of online business reviews 2021
- UGC content impact on online shoppers in the U.S. 2017
- Reasons why U.S. internet users might not trust an online review 2012
- U.S. online shoppers who have posted online reviews 2017, by gender
- Reasons for U.S. internet users to leave online reviews 2017
- Reasons for using social media after a holiday in the United Kingdom (UK) 2015-2016
- Influence of travel review sites on U.S. leisure travelers in 2012, by age
- Online users influenced by reading social media 2018, by country
- U.S. consumer concerns about the authenticity of online reviews 2015
- Luxury hotel online review distribution 2014, by author region
- U.S. shopper star-rating expectation to buy from a retailer 2019, by vertical
- Types of travel purchases influenced by travel review sites in the U.S. 2015
- Importance of guest reviews online to U.S. leisure travelers booking hotels 2017
- Level of influence travel review sites have on travel choices in the U.S. 2014-2015
- Importance of guest reviews online to U.S. business travelers booking hotels 2017
- Importance of reviews/comments to U.S. consumers when choosing clothes 2017
eMarketer. (December 15, 2017). Percentage of global internet users who use online reviews for brand and product research as of 3rd quarter 2017, by age group [Graph]. In Statista. Retrieved March 22, 2023, from https://www.statista.com/statistics/510532/using-consumer-reviews-for-brand-research-global-age/
eMarketer. "Percentage of global internet users who use online reviews for brand and product research as of 3rd quarter 2017, by age group." Chart. December 15, 2017. Statista. Accessed March 22, 2023. https://www.statista.com/statistics/510532/using-consumer-reviews-for-brand-research-global-age/
eMarketer. (2017). Percentage of global internet users who use online reviews for brand and product research as of 3rd quarter 2017, by age group. Statista. Statista Inc.. Accessed: March 22, 2023. https://www.statista.com/statistics/510532/using-consumer-reviews-for-brand-research-global-age/
eMarketer. "Percentage of Global Internet Users Who Use Online Reviews for Brand and Product Research as of 3rd Quarter 2017, by Age Group." Statista, Statista Inc., 15 Dec 2017, https://www.statista.com/statistics/510532/using-consumer-reviews-for-brand-research-global-age/
eMarketer, Percentage of global internet users who use online reviews for brand and product research as of 3rd quarter 2017, by age group Statista, https://www.statista.com/statistics/510532/using-consumer-reviews-for-brand-research-global-age/ (last visited March 22, 2023)
Percentage of global internet users who use online reviews for brand and product research as of 3rd quarter 2017, by age group [Graph], eMarketer, December 15, 2017. [Online]. Available: https://www.statista.com/statistics/510532/using-consumer-reviews-for-brand-research-global-age/