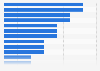
U.S. consumer beverage preference during the Super Bowl 2017
This statistic shows preferred beverages during the Super Bowl in the United States in 2017 according to a Statista survey. 62 percent of survey respondents said they usually drink soft drinks while watching the Super Bowl.
What kind of beverages do you usually drink while watching the Super Bowl?
Basic Account
Get to know the platform
You only have access to basic statistics.
This statistic is not included in your account!
Premium Account
Your perfect start with Statista
- Instant access to 1m statistics
- Download in XLS, PDF & PNG format
- Detailed references
$59 / Month *
Corporate Account
Full access
Corporate solution including all features.
* All products require an annual contract.
Prices do not include sales tax.
Further Content: You might find this interesting as well
Statistics
- Goods or services U.S. consumers associate with the Super Bowl commercials 2017
- Consumer behavior toward the Super Bowl commercials in the U.S. 2017
- Consumer opinions on the Super Bowl commercials in the U.S. 2017
- Products U.S. consumers plan to buy to enjoy the Super Bowl 2017
- (Mobile) devices U.S. consumers will use to stay informed on the Super Bowl 2017
- NFL teams U.S. consumers consider favored to win the Super Bowl 2017
- Consumer spending on the Super Bowl in the U.S. 2017, by product type
- (Mobile) devices U.S. consumers will use to follow the Super Bowl 2017
- Perceived importance of watching the actual Super Bowl game 2017
- U.S. consumers' most favorite part of the Super Bowl 2017
- Activities U.S. consumers will do while watching the Super Bowl 2017
- Where U.S. consumers will watch the Super Bowl 2017
- People with whom U.S. consumers will watch the Super Bowl 2017
- Italy: Super Bowl final TV audience 2016-2017
- Italy: share of Super Bowl final TV audience 2016-2017
- Average Super Bowl TV audience in Canada 2012-2019
- Super Bowl: U.S. adults who watched the game 2011
- TV viewership National Football League selected games 2011
- TV viewership of selected National Football League games 2012
- Survey on favored team to win the Super Bowl 2015
Further related statistics
Statista Survey. (January 18, 2017). What kind of beverages do you usually drink while watching the Super Bowl? [Graph]. In Statista. Retrieved December 11, 2019, from https://www.statista.com/statistics/661607/us-consumer-beverage-preference-during-super-bowl/
Statista Survey. "What kind of beverages do you usually drink while watching the Super Bowl?." Chart. January 18, 2017. Statista. Accessed December 11, 2019. https://www.statista.com/statistics/661607/us-consumer-beverage-preference-during-super-bowl/
Statista Survey. (2017). What kind of beverages do you usually drink while watching the Super Bowl?. Statista. Statista Inc.. Accessed: December 11, 2019. https://www.statista.com/statistics/661607/us-consumer-beverage-preference-during-super-bowl/
Statista Survey. "What Kind of Beverages Do You Usually Drink While Watching The Super Bowl?." Statista, Statista Inc., 18 Jan 2017, https://www.statista.com/statistics/661607/us-consumer-beverage-preference-during-super-bowl/
Statista Survey, What kind of beverages do you usually drink while watching the Super Bowl? Statista, https://www.statista.com/statistics/661607/us-consumer-beverage-preference-during-super-bowl/ (last visited December 11, 2019)