
Ahmed Sherif
Research expert covering IT services and gaming hardware

Detailed statistics
Revenue of T-Mobile US 2009-2023

Detailed statistics
Net income of T-Mobile US 2005-2023

Detailed statistics
Leading telecommunications companies worldwide 2024, by market cap

Telecom services: global spending forecast 2008-2024
Information technology (IT) spending on telecommunications services worldwide from 2008 to 2024 (in billion U.S. dollars)

Global communication services revenue 2017-2028, by country
Communication services revenue worldwide from 2017 to 2028, by country (in million U.S. dollars)

U.S. telecommunications mobile service revenue 1998-2022
Telecommunications revenue from mobile services in the United States from 1998 to 2022 (in billion U.S. dollars)

Mobile wireless subscriber connections in the United States 1985-2021
Number of mobile wireless subscriber connections in the United States from 1985 to 2021 (in millions)

Wireless service average revenue per unit in the United States 1993-2021
Monthly ARPU from mobile wireless services in the United States from 1993 to 2021 (in U.S. dollars)
Leading telecommunications companies worldwide 2024, by market cap
Leading telecommunications companies worldwide 2024, by market capitalization (in billion U.S. dollars)
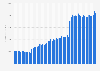
Revenue of T-Mobile US 2009-2023
Revenue of T-Mobile US from 2009 to 2023 (in billion U.S. dollars)
Revenue of T-Mobile US 2010-2024, by quarter
Revenue of T-Mobile US from 2010 to 2024, by quarter (in million U.S. dollars)

Revenue of T-Mobile US 2015-2023, by segment
Revenue of T-Mobile US from 2015 to 2023, by segment (in billion U.S. dollars)

Operating income of T-Mobile US 2005-2023
Operating income of T-Mobile US from 2005 to 2023 (in million U.S. dollars)
Net income of T-Mobile US 2005-2023
Net income of T-Mobile US from 2005 to 2023 (in million U.S. dollars)

Advertising spending of T-Mobile US 2011-2023
Advertising spending of T-Mobile US from 2011 to 2023 (in billion U.S. dollars)

Number of employees of T-Mobile US 2013-2023
Number of employees of T-Mobile US from 2013 to 2023

Most advertised brands in the U.S. 2022
Most advertised brands in the United States in 2022, by advertising spending (in billion U.S. dollars)

Revenue of major telecom services companies in the United States 2008-2023
Revenue of selected major telecommunication service companies in the United States from 2008 to 2023 (in billion U.S. dollars)

Wireless revenue of major mobile telecom operators/providers in the U.S. 2011-2023
Wireless revenue generated by major U.S. telecommunication providers from 2011 to 2023 (in billion U.S. dollars)

Wireless network operator subscriber share in the U.S. 2011-2024, by quarter
Wireless network operator subscriptions market share in the United States from 2011 to 2024, by quarter

American customer satisfaction index for full-service MVNOs in the U.S. 2020-2024
American customer satisfaction index scores for full-service mobile virtual network operators in the United States from 2020 to 2024*

U.S. 5G coverage 2024, by carrier
5G coverage share in the United States as of January 2024, by mobile carrier

5G and overall mobile download speed in the U.S. 2024, by provider
Average 5G and overall download speed by provider in the United States in 2024 (in Mbps)

Number of T-Mobile customers in the U.S. 2010-2024, by quarter and contract type
Number of T-Mobile customers in the United States from 2010 to 2024, by quarter and contract type (in thousands)

T-Mobile postpaid subscriber/customer churn rate in the U.S. 2010-2024, by quarter
Postpaid customer/subscriber churn rate of T-Mobile in the United States from 2010 to 2024, by quarter

T-Mobile prepaid subscriber/customer churn rate in the U.S. 2012-2024, by quarter
Prepaid customer/subscriber churn rate of T-Mobile in the United States from 2012 to 2024, by quarter

ARPU of T-Mobile postpaid/prepaid customers in the U.S. 2013-2024, by quarter
Average revenue per user (ARPU) of T-Mobile in the United States from 2013 to 2024, by quarter (in U.S. dollars)

Share of Americans using T-Mobile as mobile phone carrier in the U.S. 2024, by age
Share of Americans using T-Mobile as mobile phone carrier as of March 2024, by age


Mon - Fri, 9am - 6pm (EST)
Mon - Fri, 9am - 5pm (SGT)
Mon - Fri, 10:00am - 6:00pm (JST)
Mon - Fri, 9:30am - 5pm (GMT)
Mon - Fri, 9am - 6pm (EST)


