Skip to main content
Consumer Goods & FMCG
E-Commerce
Economy & Politics
Energy & Environment
Health, Pharma & Medtech
Internet
Media
Technology & Telecommunications
Transportation & Logistics
Travel, Tourism & Hospitality
View all industries
Global data volume growth
Global AI market size
Number of generative AI users worldwide
Global inflation rate
Retail e-commerce sales worldwide
Largest economies worldwide
Biggest social media platforms by users
Global EV market share by manufacturer
International tourist arrivals by world region
Global annual CO₂ emissions
Browse recent statistics
Artificial intelligence (AI) worldwide
TikTok
Nvidia
E-commerce worldwide
Global GDP
Instagram
Apparel market worldwide
Video gaming worldwide
Global renewable energy industry
Influencer marketing worldwide
Browse recent topics
Consumer Trends 2026
Artificial Intelligence: in-depth market analysis
E-commerce challenges
Global economy
TikTok
Luxury goods: in-depth market analysis
Electric vehicles: A global overview
Video gaming worldwide
Travel and tourism trends 2026
Battery recycling worldwide
Browse recent reports
Explore the tool
Explore Classic mode
Advertising & Media
eCommerce
Consumer
Finance
Global Indicators
Health
Industrial
Mobility
Technology
Explore Market Insights
eCommerce Insights
Research AI
Book a demo
All integrations
Developer docs
Explore Statista Connect
Research
Strategy & Consulting
Marketing
Media & PR
Explore AI assistants
Marketing
Research & Development
Strategy
Sales
Find the fact
Tell the story
Win the pitch
Understand the market
Develop your strategy
Academia
Agencies
Consultancies
Consumer goods
Finance
Tech
Research solutions
Strategy consulting
Communication services
Explore Statista+
Statista R
Statista Healthcare
About Statista
First steps & help center
Webinar & training hub
Success stories
Individuals & Small Teams
Businesses & Enterprises
Academia & Government
English
Deutsch
Daily Data
Infographics on the topic "+"
2016 Election
Oct 28, 2016
This chart shows responses to the question "what is the most important problem facing the U.S. today? (% U.S. adults).
More Information
NATO
Oct 28, 2016
This chart shows reponses to the question "do you think the U.S. would use military force to defend a NATO ally?"
More Information
LGBT
Oct 28, 2016
This chart shows the percentage of the population identifying as LGBT in selected countries in 2016.
More Information
Samsung Announces Third Quarter Results
Oct 27, 2016
This chart shows operating profits of Samsung's IT & Mobile communications segment.
More Information
Safety and security
Oct 27, 2016
This chart shows bottom scores for safety and security in countries worldwide.
More Information
Irish Law Enforcement
Oct 27, 2016
This chart shows where non-Irish gardaí come from.
More Information
House prices
Oct 27, 2016
This graphic shows the European house price indices in real terms (RHPI) before and after the crisis.
More Information
Apple's Earnings Report
Oct 26, 2016
This chart shows Apple's revenue since 2000.
More Information
NFL
Oct 26, 2016
This chart shows the number of Hall of Fame coaches there were active in the NFL from 1985 to 2015.
More Information
Languages
Oct 26, 2016
This chart shows the average salary in jobs requiring the following languages in the UK.
More Information
MLB - Cleveland Indians
Oct 26, 2016
This chart compares selected career statistics of the MLB 2006 draft's top ten pitchers.
More Information
MLB
Oct 26, 2016
This chart shows the inning entered and exited by Andrew Miller for the Cleveland Indians in 2016 season.
More Information
Apple Watch Sales Decline for the Second Consecutive Quarter
Oct 25, 2016
This chart shows how many iPhones, iPads and Apple Watches Apple sold over the first six quarters following their respective launches.
More Information
Wine
Oct 25, 2016
This chart shows annual per capita wine consumption worldwide.
More Information
Anti-ISIS Coalition Conference in Paris
Oct 25, 2016
This chart shows the most common type of targets of ISIS and the weapons used by the jihadists
More Information
Iraq
Oct 25, 2016
This chart shows the number of U.S. armed forces personnel in Iraq.
More Information
Stress at Work
Oct 24, 2016
This infographic shows the most dangerous workplace hazards according to UK safety representatives in 2016.
More Information
Migrant Crisis
Oct 24, 2016
This chart shows the official population of the Calais migrant camp from September 2015 to October 2016.
More Information
Time Warner Merger
Oct 24, 2016
This chart shows AT&T's global brand value from 2011 to 2016.
More Information
Mobile Broadband
Oct 24, 2016
This chart shows the availability and speed of 4G in the UK, by region.
More Information
New Console
Oct 21, 2016
This chart shows the share price of Nintendo from October 19 to October 21, 2016.
More Information
Obesity
Oct 21, 2016
This chart shows the % share of obesity among adults in EU Member States in 2014*
More Information
'Perfect Storm'
Oct 21, 2016
This chart shows an age breakdown of NHS nurses from 2006 to 2015.
More Information
ePublishing
Oct 21, 2016
This chart shows differences in eBook pricing around the world.
More Information
Fear
Oct 21, 2016
This chart shows the % of Americans who reported being "afraid" or "very afraid" of the following...
More Information
UK Politics
Oct 21, 2016
This chart shows the share of votes received by the top five candidates in Batley & Spen and Witney by-elections.
More Information
Monarchy
Oct 20, 2016
This graphic shows the total private wealth of the richest monarchs in Europe.
More Information
Top Worries
Oct 20, 2016
This chart shows the percentage in each country considering the following topics their top worry in September 2016.
More Information
US Election
Oct 20, 2016
This chart shows the flash poll results for all three presidential TV debates in 2016.
More Information
U.S. Navy
Oct 20, 2016
This chart shows some key facts behind the Zumwalt class destroyer.
More Information
Aleppo 'War Crimes'
Oct 20, 2016
This graphic shows a breakdown of documented civilian deaths caused by Russian airstrikes in Syria.
More Information
Schiaparelli Mars Landing
Oct 19, 2016
This chart gives an overview of all missions to Mars since 1960.
More Information
Innovation in the Automobile Industry
Oct 19, 2016
This chart shows the R&D intensity for Tesla and several traditional car manufacturers.
More Information
Brexit Fallout
Oct 19, 2016
This chart shows selected currencies according to their year-to-date change in exchange rate against the U.S. dollar.
More Information
TV Debate
Oct 19, 2016
This chart shows American adults' views on 2016 election candidates and issues.
More Information
US Election
Oct 18, 2016
This chart shows the share of social media posts by presidential candidates where they mention themselves.
More Information
Q3 Earnings Report
Oct 18, 2016
This chart shows the net income of Netflix from 2000 to Q3 2016.
More Information
Video Streaming
Oct 18, 2016
This chart shows how much money Netflix and Amazon invest in TV programming.
More Information
Isis
Oct 17, 2016
This infographic provides information to the Iraq offensive on Isis-held Mosul in October 2016.
More Information
Killer Clowns
Oct 14, 2016
This chart shows the number of calls received by Childline regarding 'creepy clowns'.
More Information
Trending Topics Among Startups
Oct 14, 2016
This chart shows the percentage of VC-backed companies with the following words in their company description.
More Information
Millennials
Oct 14, 2016
This chart compares priorities important to Baby Boomers and Millennials related to job benefits
More Information
Isis
Oct 14, 2016
This chart shows the schooling attainment of foreign Isis recruits.
More Information
Brexit
Oct 14, 2016
This chart shows the percentage of respondents who regret their vote in the UK's EU referendum (Oct 16).
More Information
Iraq & Syria
Oct 14, 2016
This chart shows the alleged number of airstrikes by Russia and the coalition resulting in civilian casualties in Syria & Iraq.
More Information
Amazon Launches Music Unlimited
Oct 13, 2016
This chart shows the prices for a single subscription to selected music streaming services.
More Information
Home Automation
Oct 13, 2016
This chart shows a forecast of global home automation market revenue.
More Information
The Queen
Oct 13, 2016
This chart shows the world's longest reigning living monarch.
More Information
Government Budget Policies
Oct 13, 2016
This chart shows what the British public thinks about budgetary priorities
More Information
Shopping Streets
Oct 13, 2016
This chart shows the average annual rent per square foot of retail space in 2015 (U.S. dollars).
More Information
Yemen
Oct 13, 2016
This chart shows the number of civilians killed and injured in the civil war up to October 10, 2016.
More Information
Personal Savings
Oct 13, 2016
This chart shows the share of the UK adult population with less than £100 of savings, by country/region.
More Information
Michelin stars
Oct 12, 2016
This chart shows the location of Irish restaurants with Michelin stars.
More Information
Amazon Prime
Oct 12, 2016
This chart shows how much Amazon Prime members in the U.S. spend compared to non-Prime shoppers on Amazon.
More Information
Slavery
Oct 12, 2016
This chart shows the number of female and male modern slavery victims assisted by the Salvation Army.
More Information
US Elections
Oct 12, 2016
This chart shows the main concerns of US voters in connection with the presidential election 2016
More Information
World Obesity Day
Oct 11, 2016
This chart shows the share of UK boys that are forecast to be obese by 2020, by social category.
More Information
Samsung Stops Production of the Galaxy Note 7 Smartphone
Oct 11, 2016
This chart sums up how Samsung ended up scrapping the Galaxy Note 7 smartphone.
More Information
Total Recall
Oct 11, 2016
This chart shows the number of reported incidents concerning the recalled Samsung Galaxy Note 7 in the US
More Information
Voice Calls
Oct 11, 2016
This infographic shows the share of UK smartphone users that made a voice call in the previous 7 days from 2012 to 2016.
More Information
Wealth
Oct 11, 2016
This chart shows the % of UHNW individuals who primarily inherited their wealth in selected countries (2013-14).
More Information
Exploding Galaxy Note 7 Smartphones
Oct 10, 2016
This chart breaks down Samsung's revenue by operating segment.
More Information
U.S. Job Market
Oct 10, 2016
This chart shows the % of U.S. adults who think these factors help/hurt American workers.
More Information
United Kingdom
Oct 10, 2016
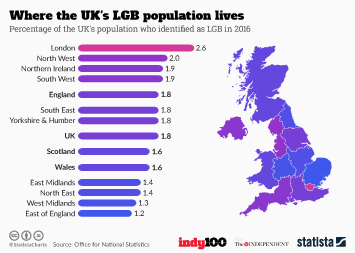
This chart shows the percentage of the UK's population who identified as LGB in 2016
More Information
2nd Presidential Debate
Oct 10, 2016
This chart shows interactions on Twitter during the 1st and 2nd presidential debate between Donald Trump & Hillary Clinton
More Information
Twitter an Acquisition Target?
Oct 7, 2016
This chart shows Twitter's stock price alongside several key events since June 2015.
More Information
Reading
Oct 7, 2016
This chart shows hours spend reading per person per week in selected countries.
More Information
Rap Politics
Oct 7, 2016
This chart shows how often Donald Trump and Hillary Clinton were metioned in hip hop lyrics since 1989
More Information
Tax
Oct 7, 2016
This chart shows undocumented immigrant's estimated annual contribution to U.S. state & local tax.
More Information
Brexit
Oct 7, 2016
This chart shows an EU referendum voting breakdown by whether respondents have family/friends in the EU.
More Information
Brexit
Oct 7, 2016
This chart shows the number of British applications for Irish passports in 2015 & 2016 (excluding Northern Ireland).
More Information
Energy
Oct 6, 2016
This chart shows the % of U.S. adults who favor/oppose expanding these energy sources.
More Information
Startups
Oct 6, 2016
This chart shows the world's most expensive offices located in creative districts.
More Information
Video On Demand
Oct 6, 2016
This chart shows the average monthly operating profit/loss per Netflix subscriber in the United States and internationally.
More Information
Pensions
Oct 6, 2016
This infographic looks at the extra annual savings required to supplement the average pension to an adequate level.
More Information
Annual Global Brand Ranking
Oct 5, 2016
This chart shows the results of Interbrand's 2016 ranking of the world's most valuable brands.
More Information
London
Oct 5, 2016
This chart shows the percentage feeling uncomfortable chatting to a seemingly-normal stranger in the UK.
More Information
Migration
Oct 5, 2016
This infographic shows a comparison of man-made barriers around the world
More Information
Workplace Trust
Oct 5, 2016
This chart shows the percentage of full-time employees with a great deal of trust in employers, bosses & team/colleagues in 2016
More Information
Donor Conference
Oct 5, 2016
This infographic shows the amount of international aid to Afghanistan from 1979 to 2014
More Information
New Statista Report
Oct 5, 2016
This chart shows the cups of coffee consumed per capita in European countries in 2015.
More Information
Refugees
Oct 5, 2016
This chart shows the top countries by the number of refugees hosted at the end of 2015.
More Information
Voice-Controlled Wireless Speakers
Oct 4, 2016
This chart shows the most popular features repeatedly used by Amazon Echo users.
More Information
Energy efficiency
Oct 4, 2016
This chart shows energy efficiency rankings of major countries in 2016.
More Information
Pollution deaths
Oct 4, 2016
This chart shows annual deaths from PM2.5 and PM10 pollution per 100,000 inhabitants.
More Information
Global Economy
Oct 4, 2016
This chart shows index scores about the countries with the most competitive economies.
More Information
Startups
Oct 4, 2016
This chart shows the most expensive 600 sq ft offices located in creative districts.
More Information
Ad Blocking
Oct 3, 2016
This chart shows the monthly desktop ad blocking rate among Facebook users worldwide by age group
More Information
Potential Takeover Bid
Sep 30, 2016
This chart shows the reach of leading digital publishers in the United States in 2016.
More Information
Smartphone Market
Sep 30, 2016
This infographic shows sales of Blackberry smarphones
More Information
136
/
161
Contact
Get in touch with us. We are happy to help.
Do you still have questions?
Feel free to contact us anytime using our
contact form
or visit our
FAQ page
.
Your contact to the Infographics Newsroom
Felix Richter
Data Journalist
felix.richter@statista.com
+49 (40) 284 841 557