Skip to main content
Consumer Goods & FMCG
E-Commerce
Economy & Politics
Energy & Environment
Health, Pharma & Medtech
Internet
Media
Technology & Telecommunications
Transportation & Logistics
Travel, Tourism & Hospitality
View all industries
Global data volume growth
Global AI market size
Number of generative AI users worldwide
Global inflation rate
Retail e-commerce sales worldwide
Largest economies worldwide
Biggest social media platforms by users
Global EV market share by manufacturer
International tourist arrivals by world region
Global annual CO₂ emissions
Browse recent statistics
Artificial intelligence (AI) worldwide
TikTok
Nvidia
E-commerce worldwide
Global GDP
Instagram
Apparel market worldwide
Video gaming worldwide
Global renewable energy industry
Influencer marketing worldwide
Browse recent topics
Consumer Trends 2026
Artificial Intelligence: in-depth market analysis
E-commerce challenges
Global economy
TikTok
Luxury goods: in-depth market analysis
Electric vehicles: A global overview
Video gaming worldwide
Travel and tourism trends 2026
Battery recycling worldwide
Browse recent reports
Explore the tool
Explore Classic mode
Advertising & Media
eCommerce
Consumer
Finance
Global Indicators
Health
Industrial
Mobility
Technology
Explore Market Insights
eCommerce Insights
Research AI
Book a demo
All integrations
Developer docs
Explore Statista Connect
Research
Strategy & Consulting
Marketing
Media & PR
Explore AI assistants
Marketing
Research & Development
Strategy
Sales
Find the fact
Tell the story
Win the pitch
Understand the market
Develop your strategy
Academia
Agencies
Consultancies
Consumer goods
Finance
Tech
Research solutions
Strategy consulting
Communication services
Explore Statista+
Statista R
Statista Healthcare
About Statista
First steps & help center
Webinar & training hub
Success stories
Individuals & Small Teams
Businesses & Enterprises
Academia & Government
English
Deutsch
Daily Data
Global stories vividly visualized
Browser Cookies
Jan 27, 2022
This chart shows the share of U.S. respondents agreeing with the following statements about cookie tracking (2021).
More Information
Holidays
Jan 27, 2022
This chart shows statutory minimum paid leave and public holidays in 2020 in selected countries.
More Information
Football
Jan 27, 2022
This chart shows the share of Premier League players that were from Africa from 1992/03 to 2021/22.
More Information
Intelligent life in space
Jan 27, 2022
This chart shows the share of U.S. respondents' belief in other intelligent life in the galaxy.
More Information
COVID-19 Pandemic
Jan 27, 2022
This chart shows the seven-day moving average of newly confirmed COVID-19 cases worldwide, by WHO region.
More Information
Gambling
Jan 27, 2022
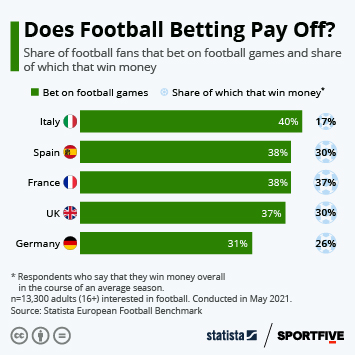
This chart shows the share of football fans in selected countries that place bets on matches, and how many of them say they make money...
More Information
Covid-19 Vaccines
Jan 27, 2022
This chart shows the number of Covid-19 vaccine doses administered per 100 people at the end of the respective month, by country income...
More Information
FMCG
Jan 26, 2022
This chart shows the favourite snack foods of UK adults.
More Information
FMCG
Jan 26, 2022
This chart shows the favorite snacks in the United States.
More Information
Global Warming
Jan 26, 2022
This chart shows the annual loss of work hours in the outdoor heavy labor industries, by global warming scenario.
More Information
Europe
Jan 26, 2022
This chart compares the military forces of Russia and Ukraine in 2022.
More Information
Smartphone prices
Jan 26, 2022
This chart shows how well different smartphone models from 2020 held their value.
More Information
Food spending habits
Jan 26, 2022
This chart shows the delivery service types used in the U.S. in the past 12 months.
More Information
Nutrition
Jan 25, 2022
This chart shows the popularity of plant-based alternatives to animal products.
More Information
Politics
Jan 25, 2022
This chart shows the highest lobbying spending in the tech industry in the U.S.
More Information
Education
Jan 24, 2022
This chart shows the longest school closures due to Covid-19, by country (in weeks).
More Information
Wordle
Jan 24, 2022
This chart shows the share of U.S. adults who play online/mobile games, by age group.
More Information
Parcel Pick-up
Jan 21, 2022
This chart shows the share of respondents by country using/requesting parcel delivery to a public pick-up station in the past 12 months...
More Information
Video games
Jan 21, 2022
This chart shows the interest of video game studios in implementing crypto payments and NFTs.
More Information
SVOD
Jan 21, 2022
This chart shows global paid net subscriber additions of Netflix in Q4 from 2016 to 2021.
More Information
U.S. Workforce
Jan 21, 2022
This chart shows the estimated number of U.S. workers missing work due to coronavirus.
More Information
American Outlook on the COVID-19 Pandemic
Jan 21, 2022
This chart shows the share of Americans expressing optimism with respect to the COVID-19 situation in the U.S.
More Information
Entertainment
Jan 20, 2022
This chart shows the number of subscribers to the biggest gaming subscription services in 2020 and 2021.
More Information
Economy
Jan 20, 2022
This chart shows forecasted salary changes for 2022, by world region.
More Information
Public opinion
Jan 20, 2022
This chart shows trustworthy and untrustworthy types of organizations.
More Information
Military Aid
Jan 20, 2022
This chart shows U.S. military aid obligations made in 2020, by recipient country (in million U.S. dollars).
More Information
Startup Economy
Jan 20, 2022
This chart shows the leading cities for startups in Africa.
More Information
Capitals
Jan 20, 2022
This chart shows major moves of capital cities within existing countries and reasons for the move.
More Information
Demographics
Jan 19, 2022
This chart shows the year in which deaths started to outnumber/are expected to outnumber births, by country.
More Information
Business
Jan 19, 2022
This chart shows levels of trust in business by country in 2021.
More Information
Trust In Government
Jan 19, 2022
This chart shows the share trusting the government and change from 2020 to 2021.
More Information
Sport
Jan 19, 2022
This chart shows the Big-5 league clubs with the shortest time played per awarded penalty.
More Information
Economy outlook
Jan 19, 2022
This chart shows the most relevant business risks in 2022.
More Information
COVID Tests
Jan 19, 2022
This chart shows the percent of U.S. government web traffic, by webpage (on Jan 18, 2022 at 1 p.m. EST).
More Information
YouTube
Jan 19, 2022
This chart shows the most viewed YouTube videos.
More Information
Covid-19 Vaccines
Jan 18, 2022
This chart shows the share of the population in selected countries which has received a coronavirus vaccine booster shot (as of Jan...
More Information
COVAX Initiative
Jan 18, 2022
This chart shows the percent gap in allocated and delivered Covid-19 vaccine doses and the number of total allocated doses through...
More Information
Firearms
Jan 18, 2022
This chart shows the number of firearms discovered in carry-on bags at U.S. airports by year.
More Information
Work
Jan 17, 2022
This chart shows the average number of hours U.S. professionals spend in video conferences each week.
More Information
Education
Jan 17, 2022
This chart shows the cities ranked as the best destinations for international university students in 2022.
More Information
Internet
Jan 17, 2022
This chart shows in which countries social media services have been blocked since 2015.
More Information
Cost of Living
Jan 17, 2022
This chart shows Kroger employees in selected markets saying they couldn't afford groceries/rent at any point during past 12 months...
More Information
Social Media Access
Jan 14, 2022
This chart shows the countries blocking or severely restricting access to Twitter.
More Information
Armed Forces
Jan 14, 2022
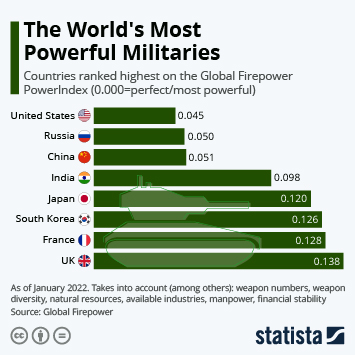
This chart shows the countries ranked highest on the Global Firepower PowerIndex in 2022.
More Information
Smartphones
Jan 14, 2022
This chart shows the 'Specific Absorption Rate' of smartphones that emit the least radiation.
More Information
Omicron Wave
Jan 14, 2022
This chart shows the share of ICU beds in use in U.S. hospitals registered with HHS (as of Jan 13, 2022).
More Information
Tech
Jan 13, 2022
This chart shows the number of apps generating more than 100 million in consumer spending from 2017 to 2021.
More Information
Smartphones
Jan 13, 2022
This chart shows the 'Specific Absorption Rate' of smartphones that emit the most radiation.
More Information
UK
Jan 13, 2022
This chart shows the share of Conservative and Leave voters that approve or disapprove of Boris Johnson's job as prime minister in...
More Information
Media
Jan 13, 2022
This chart shows the most important revenue streams in journalism.
More Information
International Trade
Jan 13, 2022
This chart shows the share of global payments made in U.S. dollar and Euro (based on transaction value).
More Information
fatal work
Jan 13, 2022
This chart shows the Number of deaths on the job per 100,000 full-time equivalent workers.
More Information
Coronavirus vaccines
Jan 13, 2022
More Information
EV Batteries
Jan 12, 2022
This chart shows the worldwide market share of the biggest electric vehicle battery makers in 2021 (based on GWh).
More Information
Music Industry
Jan 12, 2022
This chart shows album sales in the United States, by format.
More Information
Blood Donations
Jan 12, 2022
This chart shows the share of U.S. independent distribution infrastructure reporting the following levels of donor blood supply (as...
More Information
Life
Jan 11, 2022
This chart shows the most popular New Year's resolutions for 2022.
More Information
Life
Jan 11, 2022
This chart shows the most common New Year's resolutions in the United States in 2022.
More Information
Health
Jan 11, 2022
This chart shows the number of people in the U.S. waiting for an organ transplant donation, by type.
More Information
U.S. book market
Jan 11, 2022
This chart shows the average number of books read by U.S. residents per year.
More Information
Coid-19 Hospitalizations
Jan 11, 2022
This chart shows the rate of hospitalization for Covid-19 in the U.S. among children in 2021/22 (per 100,000 of population).
More Information
TikTok
Jan 11, 2022
This chart shows the highest-paid TikTok stars in 2021.
More Information
CEO-Worker pay ratio
Jan 10, 2022
This chart shows the CEO-to-worker pay ratio at Apple and at S&P 500 companies in 2021/2020.
More Information
Global Issues
Jan 7, 2022
This chart shows the countries with the most people in need of humanitarian assistance and protection in 2021.
More Information
Internet
Jan 7, 2022
This chart shows the websites with the most visits in November 2021.
More Information
Environment
Jan 7, 2022
This chart shows the total economic damage caused globally by natural disasters in 2021.
More Information
Music through the decades
Jan 7, 2022
This chart shows the mean song duration of currently streamable songs by year of release.
More Information
Crypto
Jan 7, 2022
This chart compares the share of total power used by computers for Bitcoin mining in 2019 and 2021, by country.
More Information
Gross Domestic Product
Jan 7, 2022
This chart shows the GDP change in selected OECD countries between Q4 2019 and Q3 2021.
More Information
Battery Electric Vehicle Sales
Jan 7, 2022
This chart shows the worldwide BEV sales between Q1 and Q3 2021.
More Information
S&P 500
Jan 7, 2022
This chart shows the best and worst performing sectors on the S&P 500 in 2021.
More Information
Exploration of Antarctica in the 20th century
Jan 7, 2022
This chart shows key facts about the "Heroic Age of Antarctic Exploration".
More Information
Society
Jan 6, 2022
This chart shows the top destination and origin countries of international migrants in 2020.
More Information
Covid-19
Dec 22, 2021
This chart compares worldwide Covid-19 deaths in 2021 compared to global TB, HIV and Malaria deaths in 2020.
More Information
Internet of Things
Dec 22, 2021
This chart shows the approximate household penetration of smart home security products worldwide.
More Information
Nuclear Reactors Worldwide
Dec 21, 2021
This chart shows the number of nuclear reactors currently in construction or in preliminary construction stages.
More Information
Covid-19 Variants
Dec 21, 2021
This chart shows the estimated share of new Covid-19 cases in the United States, by variant.
More Information
Politics
Dec 20, 2021
This chart shows the turnout for Hong Kong legislative elections from 1998 to 2021.
More Information
Box Office Openings
Dec 20, 2021
This chart ranks the biggest domestic opening weekends of all time.
More Information
Box Office
Dec 20, 2021
This chart shows domestic weekend box office sales since 2019.
More Information
Covid-19 vaccines
Dec 17, 2021
This chart shows the cumulative number of Covid-19 vaccine doses produced worldwide by the end of the respective months.
More Information
Prostitution
Dec 16, 2021
This chart shows the EU member states prostitution policies by type.
More Information
Emissions & Climate Change
Dec 16, 2021
This chart shows the average CO₂ emissions per capita in selected regions.
More Information
e-Mobility
Dec 15, 2021
This chart shows the ratio of electric vehicle stock to public charging points in selected countries in 2020.
More Information
Then & Now
Dec 15, 2021
This chart shows the number of buttock lift procedures in U.S. males over time.
More Information
Electric mobility
Dec 14, 2021
This chart shows how battery prices for electric cars have declined over the past few years.
More Information
Motorsport
Dec 14, 2021
This chart shows Formula 1 world championships won, by driver nationality from 1950 to 2021.
More Information
Stock Buybacks
Dec 13, 2021
This chart shows total volume of stock buybacks by S&P 500 companies.
More Information
U.S. Job Market
Dec 13, 2021
This chart shows the number of unemployed persons per job opening in the United States.
More Information
SPONSORED POST
Dec 13, 2021
More Information
58
/
161
Contact
Get in touch with us. We are happy to help.
Do you still have questions?
Feel free to contact us anytime using our
contact form
or visit our
FAQ page
.
Your contact to the Infographics Newsroom
Felix Richter
Data Journalist
felix.richter@statista.com
+49 (40) 284 841 557