Skip to main content
Consumer Goods & FMCG
E-Commerce
Economy & Politics
Energy & Environment
Health, Pharma & Medtech
Internet
Media
Technology & Telecommunications
Transportation & Logistics
Travel, Tourism & Hospitality
View all industries
Global data volume growth
Global AI market size
Number of generative AI users worldwide
Global inflation rate
Retail e-commerce sales worldwide
Largest economies worldwide
Biggest social media platforms by users
Global EV market share by manufacturer
International tourist arrivals by world region
Global annual CO₂ emissions
Browse recent statistics
Artificial intelligence (AI) worldwide
TikTok
Nvidia
E-commerce worldwide
Global GDP
Instagram
Apparel market worldwide
Video gaming worldwide
Global renewable energy industry
Influencer marketing worldwide
Browse recent topics
Consumer Trends 2026
Artificial Intelligence: in-depth market analysis
E-commerce challenges
Global economy
TikTok
Luxury goods: in-depth market analysis
Electric vehicles: A global overview
Video gaming worldwide
Travel and tourism trends 2026
Battery recycling worldwide
Browse recent reports
Explore the tool
Explore Classic mode
Advertising & Media
eCommerce
Consumer
Finance
Global Indicators
Health
Industrial
Mobility
Technology
Explore Market Insights
eCommerce Insights
Research AI
Book a demo
All integrations
Developer docs
Explore Statista Connect
Research
Strategy & Consulting
Marketing
Media & PR
Explore AI assistants
Marketing
Research & Development
Strategy
Sales
Find the fact
Tell the story
Win the pitch
Understand the market
Develop your strategy
Academia
Agencies
Consultancies
Consumer goods
Finance
Tech
Research solutions
Strategy consulting
Communication services
Explore Statista+
Statista R
Statista Healthcare
About Statista
First steps & help center
Webinar & training hub
Success stories
Individuals & Small Teams
Businesses & Enterprises
Academia & Government
English
Deutsch
Daily Data
Global stories vividly visualized
Communication
Mar 1, 2022
This chart shows the number of SpaceX Starlink satellites in space from 2019 to 2022.
More Information
Smartphones
Mar 1, 2022
This chart ranks the countries with the highest number of smartphone users.
More Information
Economy
Mar 1, 2022
This chart shows the biggest export partners of Russia in 2019.
More Information
Anti-War Protest
Feb 28, 2022
This chart shows the number of Russian protesters against the war in Ukraine detained per region (as of Feb 28, 2 p.m. CET) .
More Information
Economy
Feb 28, 2022
This chart shows the gold and foreign exchange reserves of the Central Bank of Russia from 2018 to 2022.
More Information
Russia's Reserve
Feb 28, 2022
This chart shows the largest holders of Russian central bank foreign currency and gold reserves, by geographical distribution.
More Information
Mobile Data Usage
Feb 25, 2022
This chart shows the global web traffic share by platform per region.
More Information
Import & Export
Feb 25, 2022
This chart shows the estimated change in Russia's GDP due to Western sanctions per sector.
More Information
Energy prices
Feb 25, 2022
This chart shows the EU countries with the highest share of residents unable to properly heat their homes.
More Information
Oil Price
Feb 24, 2022
This chart shows the daily price per barrel of WTI crude oil (in U.S. dollars).
More Information
Unemployment
Feb 24, 2022
This chart shows the global unemployment estimates by region.
More Information
Energy
Feb 24, 2022
This chart shows the share of gas supply from Russia in selected European countries (2020 or latest available).
More Information
Markets
Feb 24, 2022
This chart shows the percent price change for selected assets/commodity benchmarks (on Feb 24, 2021, 5 a.m. EST).
More Information
Russia-Ukraine Conflict
Feb 24, 2022
This chart shows the European Union's monthly extra-EU energy trade deficit of the since 2002.
More Information
Stock market
Feb 24, 2022
This chart shows the year-to-date development of biggest U.S. stock market indices.
More Information
Naming Reform
Feb 23, 2022
This chart shows the number of geographic site per U.S. state suggested to be renamed for including the term "squaw".
More Information
Broadcasting Rights
Feb 23, 2022
This chart shows the broadcasting rights fee per match in selected sports leagues in 2020 (in million U.S. dollars).
More Information
Crime
Feb 22, 2022
This chart shows the European countries with most reported home burglaries per 100,000 inhabitants.
More Information
U.S. Sanctions
Feb 22, 2022
This chart shows the approximate number of Russian entities subject to U.S. sanctions for the following reasons (as of Sept 1, 2021).
More Information
Mother Language Day
Feb 21, 2022
This chart shows the number of living languages spoken per country in 2021.
More Information
Mars
Feb 21, 2022
This chart shows the longest distance traveled by Mars and Moon rovers (in miles).
More Information
Oil production
Feb 18, 2022
This chart shows the African countries with the highest oil production volume.
More Information
Russian Foreign Trade
Feb 18, 2022
This chart shows Russia's international trade in goods since Q1 2000.
More Information
Climate change
Feb 17, 2022
This chart shows the number of abandoned oil and gas wells in the United States in 1990 and 2019.
More Information
NFTs
Feb 17, 2022
This chart shows sales generated by NFTs for selected luxury/collectable brands (in U.S. dollars).
More Information
Culture
Feb 17, 2022
This chart shows the number of languages classified as threatened/endangered in 2022, by region.
More Information
Supercomputers
Feb 17, 2022
The chart ranks the eight fastest supercomputers in the world based on their maximum computing power.
More Information
Food Delivery
Feb 17, 2022
This chart shows America's favorite food delivery options.
More Information
Food Delivery
Feb 17, 2022
This chart shows the gross order volume on DoorDash's marketplace.
More Information
Uber Results
Feb 17, 2022
This chart shows Uber's gross bookings, by segment.
More Information
Artificial Intelligence
Feb 17, 2022
This chart shows the countries and regions with highest number of AI research papers submitted per year.
More Information
Air Travel
Feb 17, 2022
This chart shows the net income/loss of Airbus SE from 2016 to 2021.
More Information
Mobile Apps
Feb 16, 2022
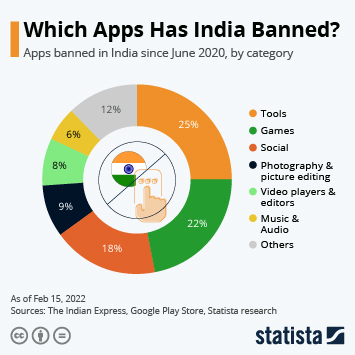
This chart shows the apps banned in India since June 2020, by category (as of Feb 15, 2022).
More Information
Doping in Sports
Feb 16, 2022
This chart shows the countries with the most Olympic medals stripped as a result of doping.
More Information
Energy
Feb 15, 2022
This chart shows the cumulative EBIT of major UK energy firms from 2016 to 2020.
More Information
E-Commerce
Feb 15, 2022
This chart shows the e-commerce brands with the highest revenue in Europe in 2020.
More Information
TV advertising
Feb 15, 2022
This chart shows the most successful ads at Super Bowl by Search Engagement Index points.
More Information
U.S. patent grants
Feb 15, 2022
This chart shows the number of U.S. patents granted to the following companies in 2021.
More Information
Armed Forces
Feb 14, 2022
This chart shows the share of the public in selected nations that expect their country to be involved in armed conflict in the next...
More Information
Dating
Feb 14, 2022
This chart shows the average cost of a "cheap date" by city in 2019.
More Information
Global
Feb 11, 2022
This chart shows countries with the best and worst 2021 Democracy Index scores.
More Information
Subsidies & Tax Abatements
Feb 11, 2022
This chart shows the biggest state-level subsidy packages in the U.S.
More Information
Super Bowl LVI
Feb 11, 2022
This chart shows certified album sales of artists performing in the 2022 Super Bowl halftime show.
More Information
Online dating
Feb 11, 2022
This chart shows the monthly downloads of Tinder by region.
More Information
Super Bowl TV advertising
Feb 11, 2022
This chart shows TV ad rates during the TV broadcast of the Super Bowl in the United States from 2010 to 2022.
More Information
Retail
Feb 11, 2022
This chart shows total expected Valentine's Day spending in the U.S.
More Information
Dating Services
Feb 10, 2022
This chart shows the share of the adult population that are active paying customers of a dating service in 2021, by country.
More Information
Best Employers
Feb 10, 2022
This chart shows the top 10 large U.S. employers as rated by employees.
More Information
Best Employers 2019
Feb 10, 2022
This chart shows the top 10 U.S. midsize employers as rated by employees.
More Information
Intellectual Property
Feb 10, 2022
This chart shows the share of women inventors among applicants for international patents in selected countries (2021).
More Information
American Football
Feb 10, 2022
This chart shows the highest-selling NFL jerseys in the final week of the regular season.
More Information
Society
Feb 9, 2022
This chart shows the countries where belief in a "Covid myth" conspiracy is most widespread.
More Information
Economy
Feb 9, 2022
This chart shows the companies with the largest market capitalization, by continent and in relation to Apple Inc.
More Information
Gambling
Feb 9, 2022
This chart shows the U.S. states where sports betting is legal.
More Information
Women in Politics
Feb 9, 2022
This chart shows the share of women in the national unicameral or lower house of parliament by country (as of January 2022).
More Information
Covid-19 vaccines
Feb 9, 2022
This chart shows the global progress towards the WHO goal of having 70% of the population fully vaccinated by mid-2022.
More Information
Pfizer
Feb 9, 2022
This chart shows Pfizer's annual revenue since 2016.
More Information
Tech
Feb 8, 2022
This chart shows how likely smartphone users in South Africa are to buy a device from a different brand in 2021.
More Information
Economy
Feb 8, 2022
This chart shows African cities ranked according to the Statista Global Business Cities index.
More Information
Climate change
Feb 8, 2022
This chart shows the share of top 25 global companies by climate responsibility integrity level.
More Information
Covid-19 Pandemic
Feb 8, 2022
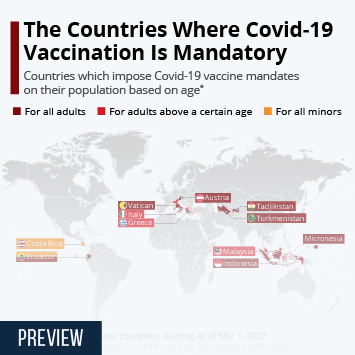
This chart shows the countries which impose Covid-19 vaccine mandates on their population based on age (as of Feb 7, 2022).
More Information
Emissions
Feb 8, 2022
This chart shows the countries with the highest annual CO₂ emissions per capita in 2020 (two million inhabitants or larger).
More Information
Headphones
Feb 7, 2022
This chart shows the most popular headphone brands in the United States.
More Information
Sport
Feb 7, 2022
This chart shows the Big-5 league football clubs with the highest net transfer spending since summer 2012.
More Information
Football
Feb 7, 2022
This chart shows the countries which have won the most Africa Cup of Nations.
More Information
E-Commerce
Feb 4, 2022
This chart shows the share of U.S. adults that were satisfied with their online interactions with major brands in 2021.
More Information
Telco
Feb 4, 2022
This chart shows internet penetration rates in African countries from 2010 to 2020.
More Information
Censorship
Feb 4, 2022
This chart shows the share of book censorship attempts in U.S. libraries, schools and universities by initiator.
More Information
Winter Olympics
Feb 4, 2022
This chart shows the Olympic Winter Games all-time medal table countries from 1924 to 2018.
More Information
Conflict
Feb 3, 2022
This chart shows the number of people in need of humanitarian assistance in Ukraine in 2021.
More Information
Climate Change
Feb 3, 2022
This chart shows the worldwide per capita CO2 emissions by fuel type.
More Information
Energy
Feb 3, 2022
This chart shows major Russian-European natural gas pipelines and theoretical capacities (in billion cubic meters per annum).
More Information
Food consumption habits
Feb 3, 2022
This chart shows the share of respondents with selected views on breakfast.
More Information
Then&Now
Feb 2, 2022
This chart shows the development of monthly visits to the website for the game Wordle.
More Information
Cryptocurrency
Feb 2, 2022
This chart shows the index value of global cryptocurrency adoption per country (as of July 2021).
More Information
Music Festivals
Feb 2, 2022
This chart shows the total attendance of the largest music festivals in the world.
More Information
Live Music Industry
Feb 2, 2022
This chart shows the share of respondents who bought music event tickets in the last 12 months.
More Information
Video Game Industry
Feb 2, 2022
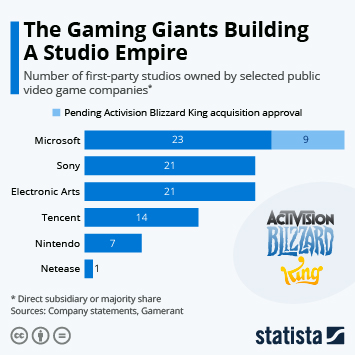
This chart shows the number of first-party studios owned by selected public video game companies.
More Information
Economy
Feb 2, 2022
This chart shows cities ranked according to the Statista Global Business Cities Index.
More Information
Aviation
Feb 1, 2022
This chart compares aircraft deliveries of Airbus and Boeing from 2008 to 2020.
More Information
Resource extraction
Feb 1, 2022
This chart shows the countries with the highest estimated number of people working in artisanal and small scale mining.
More Information
News Media
Feb 1, 2022
This chart shows the number of paid digital-only subscribers of The New York Times.
More Information
Agriculture
Feb 1, 2022
This chart shows the production of Florida and California oranges and projection for 2021/22 season (in 90-pound boxes).
More Information
Olympic Winter Games
Jan 31, 2022
This chart shows the revenue generated at Olympic Winter Games by the International Olympic Committee (1998-2018).
More Information
Economy
Jan 31, 2022
This chart shows the increase in general government gross debt in selected European countries (end of Q4 2019 to end of Q3 2021).
More Information
Nigeria
Jan 31, 2022
This chart shows the number of Nollywood films produced and censored from 2017 to 2021.
More Information
Economic Recovery
Jan 31, 2022
This chart shows the change in nonfarm payrolls in between February 2020 and December 2021, by state.
More Information
Grocery Shopping
Jan 31, 2022
This chart shows the most important purchase criteria of grocery shoppers in the U.S.
More Information
Pharma Market
Jan 28, 2022
This chart shows the estimated worldwide revenue of cancer drugs and market share in overall drug sales.
More Information
Video on demand
Jan 28, 2022
This chart shows the number of countries the world's biggest streaming services are available in.
More Information
57
/
161
Contact
Get in touch with us. We are happy to help.
Do you still have questions?
Feel free to contact us anytime using our
contact form
or visit our
FAQ page
.
Your contact to the Infographics Newsroom
Felix Richter
Data Journalist
felix.richter@statista.com
+49 (40) 284 841 557