Skip to main content
Consumer Goods & FMCG
E-Commerce
Economy & Politics
Energy & Environment
Health, Pharma & Medtech
Internet
Media
Technology & Telecommunications
Transportation & Logistics
Travel, Tourism & Hospitality
View all industries
Global data volume growth
Global AI market size
Number of generative AI users worldwide
Global inflation rate
Retail e-commerce sales worldwide
Largest economies worldwide
Biggest social media platforms by users
Global EV market share by manufacturer
International tourist arrivals by world region
Global annual CO₂ emissions
Browse recent statistics
Artificial intelligence (AI) worldwide
TikTok
Nvidia
E-commerce worldwide
Global GDP
Instagram
Apparel market worldwide
Video gaming worldwide
Global renewable energy industry
Influencer marketing worldwide
Browse recent topics
Consumer Trends 2026
Artificial Intelligence: in-depth market analysis
E-commerce challenges
Global economy
TikTok
Luxury goods: in-depth market analysis
Electric vehicles: A global overview
Video gaming worldwide
Travel and tourism trends 2026
Battery recycling worldwide
Browse recent reports
Explore the tool
Explore Classic mode
Advertising & Media
eCommerce
Consumer
Finance
Global Indicators
Health
Industrial
Mobility
Technology
Explore Market Insights
eCommerce Insights
Research AI
Book a demo
All integrations
Developer docs
Explore Statista Connect
Research
Strategy & Consulting
Marketing
Media & PR
Explore AI assistants
Marketing
Research & Development
Strategy
Sales
Find the fact
Tell the story
Win the pitch
Understand the market
Develop your strategy
Academia
Agencies
Consultancies
Consumer goods
Finance
Tech
Research solutions
Strategy consulting
Communication services
Explore Statista+
Statista R
Statista Healthcare
About Statista
First steps & help center
Webinar & training hub
Success stories
Individuals & Small Teams
Businesses & Enterprises
Academia & Government
English
Deutsch
Daily Data
Global stories vividly visualized
Life After the Pandemic
Apr 28, 2020
This chart shows the results of a survey about what Americans think should happen in their country in the aftermath of the pandemic.
More Information
Sportswear
Apr 27, 2020
This chart shows the year-over-year first-quarter net profits and sales of Adidas (in euros).
More Information
COVID-19
Apr 27, 2020
This chart shows the percentage of Americans who have experienced the following changes in their employment due to COVID-19.
More Information
COVID-19
Apr 27, 2020
This chart shows the share of U.S. adult hospitalized COVID-19 patients which have certain underlying conditions as well as the prevalence...
More Information
COVID-19 Outbreak
Apr 27, 2020
This chart shows healthcare items that could be bought for the unit price of selected military hardware.
More Information
Etsy Amid the COVID-19 Pandemic
Apr 27, 2020
This chart shows Etsy's stock performance in 2020.
More Information
United Kingdom
Apr 27, 2020
This chart present the results of a survey of GPs in the UK on the subject of PPE and the coronavirus crisis.
More Information
COVID-19 Outbreak
Apr 27, 2020
This chart shows the change in deaths from all causes in selected urban areas in 2020 vs recent years.
More Information
Telecommunications
Apr 24, 2020
This chart shows some fast facts and highlights from AT&T during Q1 of 2020.
More Information
COVID-19
Apr 24, 2020
This chart shows the cities with the largest number of Starbucks stores as of April 2019.
More Information
Environmental Impact of COVID-19
Apr 24, 2020
This chart shows the weekly average concentration of NO₂ in the air in Rome, Madrid, New York and New Delhi from February to April...
More Information
COVID-19
Apr 23, 2020
This chart shows the percentage change in electricity consumption for select U.S. organizations in March.
More Information
COVID-19 Lockdowns
Apr 23, 2020
This chart shows enforced COVID-19 lockdowns in different countries by the size of the population affected (2020).
More Information
COVID-19
Apr 23, 2020
This chart shows the percentage of cities by population size that say they anticipate immediate public funding cuts due to COVID-19.
More Information
Alphabet
Apr 23, 2020
Annual Alphabet revenue from 'YouTube ads' from 2017 to 2019.
More Information
Coronavirus
Apr 23, 2020
This chart compares the share of the total population and the share of Covid-19 deaths in England, by ethnicity.
More Information
COVID-19
Apr 22, 2020
This chart shows the percentage of people in Latin America who are satisfied with their healthcare and government.
More Information
Unemployment
Apr 22, 2020
This chart shows the unemployment rates for select countries between 2019-2021.
More Information
COVID-19
Apr 22, 2020
This chart shows publicly listed U.S. companies receiving coronavirus PPP loans, by company valuation and size of loan (as of April...
More Information
Public Opinion
Apr 22, 2020
This chart shows the percentage of Americans who have an unfavorable opinion of China.
More Information
COVID-19 Testing
Apr 22, 2020
This charts show the cumulative growth of COVID-19 test carried out in selected countries since the first case was detected (2020).
More Information
Undocumented Immigrants
Apr 22, 2020
This chart shows the estimated number of undocumented immigrants in postsecondary education in 2018.
More Information
Coronavirus
Apr 22, 2020
This chart shows the number of people tested for Covid-19 in the UK in the 24 hours up to 9am of each day.
More Information
U.S. Immigration Freeze
Apr 22, 2020
This chart shows the number of U.S. immigrant visas granted per fiscal year, by category.
More Information
Festivals
Apr 21, 2020
This chart shows the amount of beer (in million liters) poured each year during Oktoberfest.
More Information
COVID-19
Apr 21, 2020
This chart shows the estimated death tolls from COVID-19 by U.S. federal officials if social distancing ended.
More Information
Broadband Access
Apr 21, 2020
This chart shows the percentage of U.S. adults who have a home broadband connection.
More Information
COVID-19 in New York
Apr 21, 2020
This chart shows the cumulative number of COVID-19 cases registered in New York state, California and Washington state between March...
More Information
COVID-19
Apr 21, 2020
This chart shows the share of people per country who said they had worn a face mask because of the COVID-19 pandemic (as of April 12,...
More Information
Covid-19
Apr 21, 2020
this chart shows pence per litre changes to UK fuel prices in 2020 compared to the same week of 2019.
More Information
Shoe Endorsement Deals
Apr 21, 2020
This chart shows the NBA players with the highest annual earnings from signature shoe deals (as of Aug. 2019).
More Information
COVID-19 Outbreak
Apr 21, 2020
Estimated direct losses for the U.S. travel industry due to COVID-19.
More Information
COVID-19 Outbreak
Apr 21, 2020
This chart shows the estimated share of total COVID-19 deaths linked to care homes.
More Information
COVID-19
Apr 21, 2020
This chart shows the share of doctors who prescribed hydroxychloroquine for COVID-19 in selected countries (as of April 9, 2020).
More Information
Game Streaming
Apr 20, 2020
This chart shows the total streaming hours watched (in millions) and annual growth for each social platform.
More Information
Environmental impact of COVID-19
Apr 20, 2020
This chart shows the change in the concentration if NO2 in the air in selected major cities in April 2019 and 2020.
More Information
COVID-19
Apr 20, 2020
This chart shows the expected change in media consumption in India during the COVID-19 lockdown for the two weeks following March 30,...
More Information
COVID-19 Outbreak
Apr 20, 2020
This chart shows countries that have imposed temporary export restrictions on products due to COVID-19*.
More Information
COVID-19 Impact
Apr 20, 2020
This chart shows how and if Americans expect to change their behavior with respect to certain activities after the coronavirus crisis.
More Information
E-commerce
Apr 20, 2020
This chart shows the countries which spend the most on groceries online in H1 of 2019.
More Information
Earth Day
Apr 18, 2020
This chart shows the percentage of U.S. adults who say climate change is a major threat.
More Information
Earth Day
Apr 18, 2020
This chart shows the biggest drops in global carbon emissions in recorded history (in million tons).
More Information
COVID-19
Apr 17, 2020
This chart shows the daily number of new COVID-19 cases and daily number of new deaths in Spain as of April 17, 2020.
More Information
COVID-19
Apr 17, 2020
This chart shows the daily number of new COVID-19 cases and daily number of new deaths in France as of April 17, 2020.
More Information
Energy
Apr 17, 2020
This chart shows the percentage of total electricity generated by coal in each state.
More Information
Unemployment
Apr 17, 2020
This chart shows important statistics on the size and economic data of small businesses in the U.S.
More Information
Economic Impact of COVID-19
Apr 17, 2020
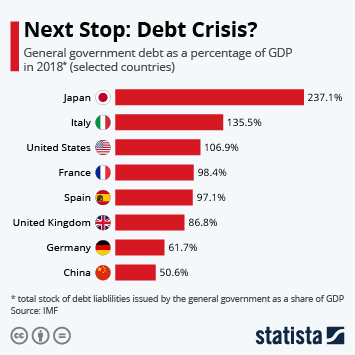
This chart shows general government debt as a percentage of GDP in 2018.
More Information
Locked up Inside?
Apr 16, 2020
Time U.S. Americans spend at different locations on average in their lives, determined by a diary study (2001).
More Information
Professional Sports During the COVID-19 Pandemic
Apr 16, 2020
This chart shows the results of a poll about if and how professional sports should return in 2020.
More Information
COVID-19
Apr 15, 2020
This chart shows the total number of COVID-19 cases and daily number of new cases in Italy as of April 17, 2020.
More Information
COVID-19
Apr 15, 2020
This charts shows the groups most likely to self-isolate among COVID-19 outbreak (2020).
More Information
Popular Apps in India
Apr 15, 2020
This chart shows the most downloaded apps in India in the week from April 8-14, 2020.
More Information
Korean Election 2020
Apr 15, 2020
This chart shows polling for the legislative election in South Korea in 2020.
More Information
Oil Market
Apr 14, 2020
This chart shows the U.S. petroleum product consumption each day since the beginning of 2020.
More Information
COVID-19
Apr 14, 2020
This chart shows what Americans think about getting back to normal life in the face of the COVID-19 pandemic.
More Information
Unemployment
Apr 9, 2020
This chart shows the initial jobless claims in the past three weeks for each state (Mar. 21 - Apr. 4).
More Information
Coronavirus Ripple Effects
Apr 9, 2020
This chart shows the change in electricity consumption in selected countries on 8 April 2020 compared to 2019.
More Information
COVID-19 Outbreak
Apr 9, 2020
This chart shows additional people in poverty due to a 20% income drop caused by a Covid-19 recession*.
More Information
COVID-19
Apr 9, 2020
This chart shows the percentage of U.S. adults who believe COVID-10 was created naturally or in a lab.
More Information
COVID-19 Outbreak
Apr 7, 2020
This chart shows the African American share of state/city populations and COVID-19 deaths (as of Apr 06, 2020).
More Information
Coronavirus
Apr 7, 2020
This chart shows the critical care unit outcomes for Covid-19 patients in the UK.
More Information
COVID-19
Apr 6, 2020
This chart shows the percentage of people who trust information on the coronavirus from President Trump.
More Information
COVID-19 Outbreak
Apr 6, 2020
This chart shows the number of new daily Covid-19 infections in Germany.
More Information
Covid-19
Apr 6, 2020
This chart shows the change in movements in New York after the coronavirus lockdown as recorded by Google location data, by category.
More Information
COVID-19 Outbreak
Apr 6, 2020
This chart shows the nationality of critically ill coronavirus patients transferred to German hospitals.
More Information
COVID-19
Apr 6, 2020
This chart shows the number of COVID-19 tests performed per million of the population (April 06, 2020).
More Information
Healthcare
Apr 4, 2020
This chart shows the number of nurses and midwives per 10,000 people in each country.
More Information
Unemployment
Apr 3, 2020
This chart shows the highest unemployment rates in U.S. history.
More Information
COVID-19
Apr 3, 2020
This chart shows the percentage of deaths by gender due to the COVID-19 disease.
More Information
Economic Impact of COVID-19
Apr 3, 2020
This chart shows jobs cut in March 2020, by industry, due to the coronavirus impact.
More Information
News Media
Apr 2, 2020
This chart shows the percentage viewership by partisan affiliation for each U.S. news media outlet.
More Information
Stockpiling
Apr 2, 2020
This chart shows the rise in revenue generated toilet paper selected countries in March 2020 (compared to March 2019).
More Information
COVID-19 Outbreak
Apr 2, 2020
This chart shows countries who have closed borders to noncitizens and nonresidents (as of March 31, 2020).
More Information
COVID-19 Pandemic
Apr 2, 2020
This chart shows the status of "stay at home orders" issued by U.S. states due to COVID-19.
More Information
Popular Apps
Apr 2, 2020
This chart shows the most downloaded apps in the U.S. in the week from March 26 to April 1, 2020.
More Information
COVID-19 Outbreak
Apr 2, 2020
This chart shows the purpose and protective effect of selected face masks.
More Information
Presidential election
Apr 1, 2020
This chart shows the percentage of U.S. voters who would vote for each candidate if the elections were held today.
More Information
Investing
Apr 1, 2020
This chart shows the behavior of stockholders in the U.S. due to COVID-19 (in %).
More Information
Census Day
Apr 1, 2020
This chart shows the most gerrymandered districts in the U.S. by compactness index (as of April 1, 2020).
More Information
COVID-19 in Australia
Apr 1, 2020
This chart shows the reduction in flight departures at Australia's busiest airport due to coronavirus (2020).
More Information
COVID-19 Outbreak
Apr 1, 2020
This chart shows health expenditure as a percentage of GDP in 2018.
More Information
COVID-19 in India
Apr 1, 2020
This charts shows the Indian government's coronavirus aid package for the poor opposite expected economic losses as well as groups...
More Information
COVID-19 Outbreak
Apr 1, 2020
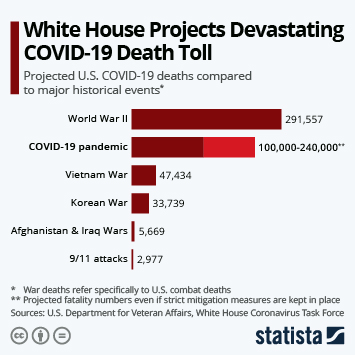
This chart shows projected U.S. COVID-19 deaths compared to major historical events.
More Information
COVID-19
Mar 31, 2020
This chart shows the total number of COVID-19 cases and daily number of new cases in Iran as of March 31, 2020.
More Information
Coronavirus
Mar 31, 2020
This chart shows the change in online interest in selected products over the past 30 days (as of March 31).
More Information
COVID-19 Outbreak
Mar 31, 2020
This chart shows patient capacity & crew of a Mercy-class hospital ship.
More Information
COVID-19 Outbreak
Mar 31, 2020
This chart shows the estimated number of averted deaths due to COVID-19 intervention (up to Mar 31).
More Information
COVID-19 Outbreak
Mar 31, 2020
This chart shows responses to "what are your main worries or concerns about the COVID-19 pandemic?"
More Information
COVID-19
Mar 31, 2020
This chart shows the countries targeted by largest share of global malicious spam emails with 'coronavirus' in the subject.
More Information
COVID-19
Mar 31, 2020
This chart details known coronavirus-related malicious online threats, by type.
More Information
80
/
161
Contact
Get in touch with us. We are happy to help.
Do you still have questions?
Feel free to contact us anytime using our
contact form
or visit our
FAQ page
.
Your contact to the Infographics Newsroom
Felix Richter
Data Journalist
felix.richter@statista.com
+49 (40) 284 841 557