Skip to main content
Consumer Goods & FMCG
E-Commerce
Economy & Politics
Energy & Environment
Health, Pharma & Medtech
Internet
Media
Technology & Telecommunications
Transportation & Logistics
Travel, Tourism & Hospitality
View all industries
Global data volume growth
Global AI market size
Number of generative AI users worldwide
Global inflation rate
Retail e-commerce sales worldwide
Largest economies worldwide
Biggest social media platforms by users
Global EV market share by manufacturer
International tourist arrivals by world region
Global annual CO₂ emissions
Browse recent statistics
Artificial intelligence (AI) worldwide
TikTok
Nvidia
E-commerce worldwide
Global GDP
Instagram
Apparel market worldwide
Video gaming worldwide
Global renewable energy industry
Influencer marketing worldwide
Browse recent topics
Consumer Trends 2026
Artificial Intelligence: in-depth market analysis
E-commerce challenges
Global economy
TikTok
Luxury goods: in-depth market analysis
Electric vehicles: A global overview
Video gaming worldwide
Travel and tourism trends 2026
Battery recycling worldwide
Browse recent reports
Explore the tool
Explore Classic mode
Advertising & Media
eCommerce
Consumer
Finance
Global Indicators
Health
Industrial
Mobility
Technology
Explore Market Insights
eCommerce Insights
Research AI
Book a demo
All integrations
Developer docs
Explore Statista Connect
Research
Strategy & Consulting
Marketing
Media & PR
Explore AI assistants
Marketing
Research & Development
Strategy
Sales
Find the fact
Tell the story
Win the pitch
Understand the market
Develop your strategy
Academia
Agencies
Consultancies
Consumer goods
Finance
Tech
Research solutions
Strategy consulting
Communication services
Explore Statista+
Statista R
Statista Healthcare
About Statista
First steps & help center
Webinar & training hub
Success stories
Individuals & Small Teams
Businesses & Enterprises
Academia & Government
English
Deutsch
Daily Data
Global stories vividly visualized
COVID-19 Outbreak
May 18, 2020
This chart shows the number of ICU beds per 10,000 inhabitants in 2018.
More Information
Tourism
May 18, 2020
This chart shows the most visited historical and cultural monuments in the World in 2018.
More Information
Basketball
May 18, 2020
This chart shows how NBA fans rate Michael Jordan vs. LeBron James.
More Information
Professional Sports
May 18, 2020
This chart shows TV viewership for the German Bundesliga.
More Information
COVID-19 Outbreak
May 18, 2020
This chart shows the number of COVID-19 tests performed per 1,000 inhabitants as of May 16.
More Information
COVID-19
May 17, 2020
This chart shows the projected total deaths and peak date of daily deaths for each state due to COVID-19 as of April 13.
More Information
Remote Working
May 15, 2020
This chart shows U.S. attitudes towards remote working on an individual and industry level during the COVID-19 crisis.
More Information
Consumer Electronics
May 15, 2020
This chart shows the quarterly domestic shipping volumes of Chinese smartphone manufacturers.
More Information
Coronavirus
May 15, 2020
This chart shows the daily number of newly confirmed COVID-19 cases in Brazil.
More Information
COVID-19 Outbreak
May 15, 2020
This chart shows the percentage of trips that were domestic or abroad in selected EU countries in 2017.
More Information
Food delivery
May 14, 2020
This chart shows some highlights from Q1 2020 earnings report for Grubhub.
More Information
COVID-19
May 14, 2020
This chart shows the percent share of off-premises U.S. restaurant sales for 2020.
More Information
COVID-19
May 13, 2020
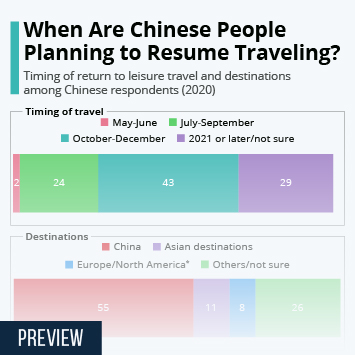
This chart shows when Chinese people are planning to resume leisure travel after the coronavirus pandemic and where they are planning...
More Information
COVID-19
May 13, 2020
This chart shows the percent change from previous year in weekly ad spending for several key industries.
More Information
COVID-19
May 13, 2020
This chart shows the percentage of U.S. adults who are likely/unlikely to use a cell phone-based COVID-19 contact tracing system.
More Information
Unemployment
May 13, 2020
This chart shows jobless benefits as a share of previous (average) income individuals receive after being unemployed for six months...
More Information
Smartphone Market
May 13, 2020
This chart shows worldwide quarterly smartphone shipments.
More Information
Facebook
May 13, 2020
This chart shows the amont and types of content Facebook took action on in Q1 2020.
More Information
COVID-19 Outbreak
May 13, 2020
This chart shows the number of people who believe they contracted COVID-19 in Ischgl, Austria.
More Information
COVID-19
May 13, 2020
This chart shows a contact tracing response in Seoul, South Korea, after a clubgoer was tested positive for coronavirus (2020).
More Information
COVID-19
May 12, 2020
This chart shows the percentage of U.S. adults who think each entity is the main source of false or misleading coronavirus information.
More Information
Motorsport
May 12, 2020
This chart shows the circuits which have hosted the most Formula One Grand Prix (1950-2019).
More Information
SPONSORED POST
May 12, 2020
Statista Content & Information Design's animated graphic highlights three good news stories that have unfolded during the Coronavirus...
More Information
2020 Election
May 12, 2020
This chart shows the share favoring their state allowing voting by mail/absentee ballot in the 2020 presidential election.
More Information
COVID-19 Outbreak
May 12, 2020
This chart shows the share of the public who have worn a face mask in public over the past two weeks.
More Information
COVID-19 Economic Impact
May 12, 2020
This chart shows which places Americans are likely to avoid for a while even after COVID-19 restrictions are lifted.
More Information
Working From Home
May 12, 2020
This chart shows how and if American full-time workers would like to change their work situation after the COVID-19 crisis.
More Information
Coronavirus
May 12, 2020
This chart shows the daily number of Covid-19 tests conducted in the UK.
More Information
Electricity
May 11, 2020
This chart shows both the five-year average and 2020 figures for the wholesale power prices by U.S. region (in dollars per MWh).
More Information
COVID-19 & Africa
May 11, 2020
This chart shows the percentage of people in Africa who have the following opinions relating to COVID-19 in their country.
More Information
Foreign Debt
May 11, 2020
This chart shows the countries with the highest foreign debt.
More Information
COVID-19 Outbreak
May 11, 2020
This chart shows financial responses to the COVID-19 pandemic as a share of GDP (selected countries).
More Information
COVID-19 Outbreak
May 11, 2020
This chart shows the share saying the UK government handled things better/worse than the following countries.
More Information
Economic Impact of COVID-19
May 11, 2020
This chart shows the number of unemployed persons in the U.S. broken down by industry.
More Information
COVID-19
May 8, 2020
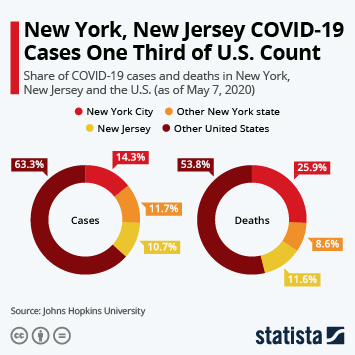
This chart shows the share New York City, New York state and New Jersey have in all COVID-19 cases and deaths recorded in the U.S....
More Information
Single Parents
May 8, 2020
This chart shows the share of children under the age of 18 living with single parents around the world in 2018.
More Information
COVID-19
May 8, 2020
This chart shows attitudes of U.S. Americans to use certain modes of transportation during the COVID-19 pandemic (2020).
More Information
COVID-19 Impact
May 8, 2020
This chart shows the number of initial jobless claims as reported weekly by the U.S. Department of Labor.
More Information
COVID-19
May 7, 2020
This chart shows the change in employment for the following U.S. nonfarm private businesses and industries in April 2020.
More Information
New York
May 7, 2020
This chart shows some findings from an April 2020 survey of COVID-19 patients in 113 New York hospitals.
More Information
COVID-19
May 7, 2020
This chart shows the percentage of U.S. adults who say they or someone in their household has lost a job or taken a paycut due to COVID-19.
More Information
COVID-19
May 7, 2020
This chart shows the biggest private donations to coronavirus causes (as of April 27, 2020).
More Information
COVID-19 Outbreak
May 7, 2020
This chart shows the Spring 2020 GDP growth forecast for the EU.
More Information
COVID-19 Economic Impact
May 7, 2020
This chart shows the European Commission's latest GDP growth forecast for the euro area and the EU.
More Information
Family Month
May 6, 2020
This chart shows expected spending during family month in South Korea in 2019 and 2020, by specific holiday.
More Information
COVID-19
May 6, 2020
This chart shows the number of high-poverty neighborhoods in U.S. metro areas between 1980-2018.
More Information
COVID-19 Outbreak
May 6, 2020
This chart shows the share of the public who think their state should be allowed to reopen the following.
More Information
Economy
May 6, 2020
This chart shows the percentage year-over-year change of the median price of U.S. existing homes and overall sales.
More Information
Climate Change
May 6, 2020
This chart shows GDP losses in selected countries due to global warming goals under the Paris Agreement and faster global warming without...
More Information
Coronavirus
May 6, 2020
This chart shows the European countries with the most Covid-19 associated deaths.
More Information
Disney
May 6, 2020
This chart shows Disney's operating profit by segment in the first three months of 2020.
More Information
COVID-19
May 5, 2020
This chart shows the performance of top economic indices from the Institute for Supply Management between March-April 2020 (in percent).
More Information
COVID-19
May 5, 2020
This chart shows the dates when European countries started to ease their coronavirus lockdown measures.
More Information
Global Response to COVID-19
May 5, 2020
This chart shows initial contributions pledged by co-chairs of the Coronavirus Global Response Initiative.
More Information
Meat Eaters
May 5, 2020
This chart shows annual meat consumption per capita worldwide in 2018.
More Information
Honey Bee Colonies
May 5, 2020
This chart shows the number of honey producing bee colonies in the U.S. by year (thousands).
More Information
COVID-19
May 4, 2020
This chart shows statistics relative to COVID-19 cases and deaths from ocean cruise ships.
More Information
Contact Tracing
May 4, 2020
This chart shows the percentage of U.S. adults opinions on how location tracking through cell phones would help limit the spread of...
More Information
COVID-19
May 4, 2020
This chart shows the percent national average of mobile devices that stayed home on select days from February to April.
More Information
Air Pollution
May 4, 2020
This chart shows the estimated number of premature deaths avoided due to lower air pollutant exposure.
More Information
COVID-19 Outbreak
May 4, 2020
This chart shows the number of meat processing plants reporting COVID-19 cases in U.S. states.
More Information
Public Opinion on COVID-19 Lockdown
May 4, 2020
This chart shows the results of a recent poll about whether Americans would be ready to return to normal life if there weren't any...
More Information
COVID-19 & Privacy
Apr 30, 2020
This chart shows the percentage of U.S. smartphone users who would trust each organization with private data gained from contact tracing...
More Information
COVID-19 & Privacy
Apr 30, 2020
This chart shows the percentage of U.S. smartphone users who would or wouldn't use a contact tracing app for COVID-19.
More Information
COVID-19
Apr 30, 2020
This chart shows the global rise in gender-based violence and the loss of access to contraception due COVID-19.
More Information
COVID-19 Outbreak
Apr 30, 2020
This chart shows the number of COVID-19 deaths, recoveries, cases and tests in South Korea.
More Information
Remote Working
Apr 30, 2020
This chart shows the top reasons for remote working in 2019, as cited by U.S. remote workers.
More Information
Workplace Communication
Apr 30, 2020
This chart shows daily active users of workplace communication app Teams.
More Information
COVID-19 Pandemic
Apr 30, 2020
This chart shows year-to-date stock performance of selected biotech/pharma companies working on drugs against COVID-19.
More Information
COVID-19
Apr 30, 2020
This chart shows newly confirmed COVID-19 infections in South Korea
More Information
COVID-19 in India
Apr 30, 2020
This chart contains index values showing how positive impressions among Indian consumers about brands Zomato and Swiggy rose during...
More Information
COVID-19
Apr 29, 2020
This chart shows the percentage of U.S. adults aged 70 and older who have had the following delays to medical procedures in the first...
More Information
Pharmaceuticals
Apr 29, 2020
This chart shows the percentage of total health spending toward retail prescription drugs, 2000-2026.
More Information
Pharmaceuticals
Apr 29, 2020
This chart shows the percentage of people who think prescription drug prices have changed since 2017.
More Information
Economic Impact of COVID-19
Apr 29, 2020
This chart shows the expected change in U.S. consumer spending due to COVID-19 by category (as of April 13, 2020).
More Information
Health
Apr 29, 2020
This chart shows the estimated additional cancer deaths in England over the next 12 months due to the Covid-19 emergency.
More Information
Economic Impact of COVID-19
Apr 29, 2020
This chart shows expected GDP growth in selected developed economies in 2020 as a result of the COVID-19 pandemic (as of April 14,...
More Information
COVID-19 Outbreak
Apr 29, 2020
This chart shows the status of religious gatherings in U.S. states on April 24, 2020
More Information
Coronavirus Crisis
Apr 29, 2020
This chart shows the countries/territories where food imports account for largest share of total merchandise imports.
More Information
COVID-19
Apr 29, 2020
This chart shos the number of confirmed COVID-19 cases in the United States.
More Information
COVID-19 Outbreak
Apr 29, 2020
This chart shows deaths from the 2020 COVID-19 pandemic and Vietnam War in comparison.
More Information
COVID-19
Apr 28, 2020
This chart shows the percentage of people from each country who say it would be easy or difficult to self-isolate.
More Information
Electronics
Apr 28, 2020
This chart shows an updated forecast for U.S. consumer electronics sales in 2020 and relative year-to-year difference.
More Information
COVID-19
Apr 28, 2020
This chart shows the share share jobless claims by women in the U.S. before and after the coronavirus shutdown (2020).
More Information
Restructuring
Apr 28, 2020
This chart shows the amount of revolving loans by industry between March 1 and April 9 (in billion U.S. dollars).
More Information
COVID-19 Outbreak
Apr 28, 2020
This chart shows reported COVID-19 deaths as a share of total U.S. excess deaths (March 01 through April 04).
More Information
Sports Betting
Apr 28, 2020
This chart shows the percentage of respondents interested in betting money on alternative events amid the shutdown of pro sports.
More Information
Military Spending
Apr 28, 2020
This chart shows estimated military expenditure as a % of GDP in selected countries in 2019.
More Information
COVID-19 Outbreak
Apr 28, 2020
Share of the public worried about coronavirus outbreaks and likely to support wet/wildlife market closures.
More Information
COVID-19
Apr 28, 2020
This chart shows survey responses in selected countries to do with reopening the economy and the COVID-19 pandemic (as of April 19,...
More Information
79
/
161
Contact
Get in touch with us. We are happy to help.
Do you still have questions?
Feel free to contact us anytime using our
contact form
or visit our
FAQ page
.
Your contact to the Infographics Newsroom
Felix Richter
Data Journalist
felix.richter@statista.com
+49 (40) 284 841 557