Skip to main content
Consumer Goods & FMCG
E-Commerce
Economy & Politics
Energy & Environment
Health, Pharma & Medtech
Internet
Media
Technology & Telecommunications
Transportation & Logistics
Travel, Tourism & Hospitality
View all industries
Global data volume growth
Global AI market size
Number of generative AI users worldwide
Global inflation rate
Retail e-commerce sales worldwide
Largest economies worldwide
Biggest social media platforms by users
Global EV market share by manufacturer
International tourist arrivals by world region
Global annual CO₂ emissions
Browse recent statistics
Artificial intelligence (AI) worldwide
TikTok
Nvidia
E-commerce worldwide
Global GDP
Instagram
Apparel market worldwide
Video gaming worldwide
Global renewable energy industry
Influencer marketing worldwide
Browse recent topics
Consumer Trends 2026
Artificial Intelligence: in-depth market analysis
E-commerce challenges
Global economy
TikTok
Luxury goods: in-depth market analysis
Electric vehicles: A global overview
Video gaming worldwide
Travel and tourism trends 2026
Battery recycling worldwide
Browse recent reports
Explore the tool
Explore Classic mode
Advertising & Media
eCommerce
Consumer
Finance
Global Indicators
Health
Industrial
Mobility
Technology
Explore Market Insights
eCommerce Insights
Research AI
Book a demo
All integrations
Developer docs
Explore Statista Connect
Research
Strategy & Consulting
Marketing
Media & PR
Explore AI assistants
Marketing
Research & Development
Strategy
Sales
Find the fact
Tell the story
Win the pitch
Understand the market
Develop your strategy
Academia
Agencies
Consultancies
Consumer goods
Finance
Tech
Research solutions
Strategy consulting
Communication services
Explore Statista+
Statista R
Statista Healthcare
About Statista
First steps & help center
Webinar & training hub
Success stories
Individuals & Small Teams
Businesses & Enterprises
Academia & Government
English
Deutsch
Daily Data
Global stories vividly visualized
Netflix
Dec 19, 2019
This chart shows the annual output by Netflix and total U.S. TV industry from 2002 to 2019.
More Information
Vladimir Putin
Dec 19, 2019
This chart shows the length of President Vladimir Putin's annual press conference by year.
More Information
Impeachment
Dec 19, 2019
This chart shows the votes in the U.S. House of Representatives that led to the impeachment of President Trump on Dec. 18, 2019.
More Information
U.S. Energy Consumption
Dec 19, 2019
This chart shows reasons why U.S. homeowners have or would install solar panels at home.
More Information
Trump Administration
Dec 19, 2019
This chart shows the duration of Trump's longest rallies since he became president.
More Information
Impeachment
Dec 19, 2019
This chart shows opinion on whether President Trump should be impeached.
More Information
Migration
Dec 19, 2019
This chart shows the global Venezuelan migrant stock from 2005 to 2019.
More Information
Women
Dec 18, 2019
This chart shows how men and women view male and female leaders.
More Information
Climate Credits
Dec 18, 2019
This chart shows Australia's balance of carry-over carbon credits compared to the country's emission reduction goals under the Paris...
More Information
Aircraft Carriers
Dec 18, 2019
This chart shows the number of aircraft carriers operated worldwide as of December 2019.
More Information
Trump Administration
Dec 18, 2019
This chart shows how U.S. adults answered when asked, "Which Republican president was better?"
More Information
U.S. Treasuries
Dec 18, 2019
This chart shows the most common countries among foreign holders of U.S. treasuries in Oct 2018 and 2019.
More Information
National Defense
Dec 18, 2019
This chart shows survey responses of South Koreans to questions concerning the proposed increase of payments for U.S. troops in the...
More Information
UK General Election
Dec 18, 2019
This chart shows 2019 general election voting for selected parties by age.
More Information
Health
Dec 18, 2019
This chart shows caesarean births as a percentage of live births in 2017
More Information
Social Media
Dec 17, 2019
This chart shows the distribution of U.S. adults according to frequency using social media, by platform.
More Information
Trump Administration
Dec 17, 2019
This chart shows how U.S. adults answered when asked, "Has President Donald Trump..."
More Information
Automobile Exports
Dec 17, 2019
This chart shows the top 4 automakers exporting American-made vehicles to China in 2018.
More Information
Christmas Tree Sales
Dec 17, 2019
This chart shows the estimated number of real & fake Christmas trees purchased in the U.S. by year.
More Information
Immigration
Dec 17, 2019
This chart shows U.S. Immigration & Customs Enforcement removals by country of citizenship in 2018.
More Information
College & University
Dec 17, 2019
This chart shows the percent of U.S. adults who said a specific freedom was being threatened.
More Information
New Year
Dec 16, 2019
This chart show the most popular new year's resolutions among U.S. Americans for 2020.
More Information
Saudi Aramco IPO
Dec 13, 2019
This chart shows the market caps of Saudi Aramco and selected large publicly-listed companies on Dec 12, 2019.
More Information
Movie Industry
Dec 13, 2019
This chart shows how people answered, "Do you think 'Die Hard' is a Christmas movie?"
More Information
UL Politics
Dec 13, 2019
This chart shows the Conservative general election majority in Uxbridge and South Ruislip from 2010 to 2019.
More Information
UK 2019
Dec 13, 2019
This chart shows the share of 2019 election vote won by parties, grouped according to their stance on Brexit/Europe.
More Information
UK Election
Dec 13, 2019
This chart shows general election voter turnout in the UK from 1997 to 2019.
More Information
United Kingdom
Dec 13, 2019
This chart shows the share of vote received by main party leaders in 2019 general election and change on 2017.
More Information
Dec 13, 2019
This chart shows the Scottish seats won in the 2019 UK general election and change on 2017 result, by party.
More Information
UK Election
Dec 13, 2019
This chart shows the seats won in the 2019 UK general election and change on 2017 result, by party.
More Information
Interest Rates
Dec 12, 2019
This chart compares the U.S. federal funds rate to the ECB's interest rate for main refinancing operations since the end of the Great...
More Information
GAFAM
Dec 12, 2019
This chart shows the market capitalization of Google, Apple, Facebook, Amazon and Microsoft at the beginning of 2010 and at the end...
More Information
Tech of the Decade
Dec 12, 2019
This chart shows notable tech products & online services launched in the past decade.
More Information
E-Commerce in the U.S.
Dec 11, 2019
This chart shows the percentage of holiday spending attitudes among U.S. adults.
More Information
Bushfires
Dec 11, 2019
This chart shows levels of PM2.5 pollution in Sydney on Dec 10 and 11, 2019
More Information
UK Election 2019
Dec 11, 2019
This chart reveals the most common policies from the Conservative and Labour 2019 manifestos that the British public are aware of.
More Information
UK Election 2019
Dec 11, 2019
This chart compares exit polls featured by the BBC and the actual UK general election results from 2001 to 2017.
More Information
Christmas
Dec 11, 2019
This chart shows the share of the U.S. public with Christmas tree plans for 2019.
More Information
Apple
Dec 11, 2019
Price for the lowest and highest spec Mac Pro in December 2019.
More Information
UK Election 2019
Dec 11, 2019
This infographic shows a comparison of exit poll seat predictions for the winning party and the actual UK general election results...
More Information
Climate Change Policy
Dec 11, 2019
This chart shows national climate change policy index scores in 2019 (100 = best performance).
More Information
UK Politics
Dec 11, 2019
This chart shows the projected seats won in the 2019 UK general election, by party.
More Information
Environment
Dec 11, 2019
This chart shows the states with the largest cuts to environmental agency funding from 2008 to 2018.
More Information
Employment
Dec 10, 2019
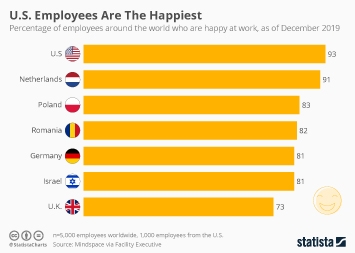
This chart shows the percentage of employees around the world who are happy at work, as of December 2019.
More Information
Media and Politics in the U.S.
Dec 10, 2019
This chart shows the percent of Democratic and Republican voters who can or cannot agree on important U.S. issues.
More Information
Youth Suicides
Dec 10, 2019
This chart shows the percent share of U.S. suicides (age 10-19) by sex.
More Information
Smartphone Economy
Dec 10, 2019
This chart shows estimated sales of smartphones and related hardware, content and services in 2020.
More Information
Smartphone Market
Dec 10, 2019
This chart shows estimated global smartphone shipments since 2008 and a forecast until 2023.
More Information
Terrorism
Dec 10, 2019
This chart shows the estimated number of people killed in ISIS terrorist attacks and territory controlled by the group.
More Information
Public Health Services
Dec 10, 2019
This chart shows the annual average real growth rates in UK public spending on health, by government/period from 1949 to 2017.
More Information
Politics
Dec 9, 2019
This chart shows appearances of politicians in national news coverage between 7 Nov and 4 Dec 2019.
More Information
Computerized Trading
Dec 9, 2019
This chart shows the share of computerized and human trading in U.S. equities in October 2019.
More Information
Air pollution
Dec 9, 2019
This chart shows per-capita CO² emissions in selected countries.
More Information
Maritime Emissions
Dec 9, 2019
This chart shows CO2 from ships vs emissions from national car fleets in 2019 (million tons).
More Information
Advertising
Dec 9, 2019
This chart shows a forecast of advertising revenue in the United States.
More Information
Pollution
Dec 9, 2019
This chart shows megatonnes of CO2 equivalent produced in 2018.
More Information
Germany
Dec 9, 2019
This chart shows average life expectancy in German federal states by gender (years).
More Information
Uber
Dec 9, 2019
This chart shows reported incidents of sexual assault received by Uber in the U.S.
More Information
World Leaders
Dec 9, 2019
This chart shows the youngest elected state leaders worldwide as of December 2019.
More Information
Brexit
Dec 9, 2019
This chart shows how EU citizens living in the UK would vote in the 2019 general election.
More Information
Brexit
Dec 9, 2019
This chart shows the percentage of EU citizens living in the UK who have or haven't considering leaving due to Brexit.
More Information
Climate Change
Dec 6, 2019
This chart shows the percent of U.S. adult who say their local communities are impacted by global climate change.
More Information
College Football
Dec 6, 2019
This chat shows the U.S. college football programs earning most profits (three-year average).
More Information
Dentist
Dec 6, 2019
This chart shows the average number of dental consultations per inhabitant in 2017.
More Information
Extreme Weather Events
Dec 6, 2019
This chart shows annual average fatalities per 100,000 inhabitants due to extreme weather events from 1998 to 2017.
More Information
Passenger Airlines in the U.S.
Dec 5, 2019
This chart shows round-trip airfares from the U.S. two weeks before and after a new competitor route is announced.
More Information
Credit Card Debt
Dec 5, 2019
This chart show the U.S. municipalities where Millennials had the highest average per capita credit card debt.
More Information
Chewing Gum Market
Dec 5, 2019
This chart shows what U.S. consumers say they want to get from their gum, as of December 2018.
More Information
Superhero Movies
Dec 5, 2019
This chart shows gross box office sales in the U.S. for movies released in 2019, as of December 2.
More Information
2020 Presidential Election
Dec 5, 2019
This chart shows the percent of Democrats who say the best age for a U.S. president is in their...
More Information
Cinema
Dec 5, 2019
This chart shows the % of the UK public considering the following their favourite Bond actor (April 2019).
More Information
Beyond Meat
Dec 5, 2019
This chart shows the share price of Beyond Meat since the company's IPO on May 2, 2019.
More Information
Online Shopping
Dec 5, 2019
This chart shows the percentage of U.S. consumer motivations for buying online.
More Information
Soccer
Dec 5, 2019
This chart shows commissions by agents/intermediaries involved in international soccer transfers.
More Information
Parental Leave
Dec 5, 2019
This chart shows the % of U.S. parents who took parental leave and who were fully, partly or not paid in 2019.
More Information
Bush Fires
Dec 4, 2019
This chart shows the Australian cites with most days of unhealthy air pollution in 2019 (as of Dec 3).
More Information
Spotify
Dec 4, 2019
More Information
Health
Dec 4, 2019
This chart shows the correlation between frequency of ramen restaurants and stroke mortality in Japanese prefectures.
More Information
Potatoes
Dec 4, 2019
This chart shows U.S. potato production by year (1,000 cwt).
More Information
Energy
Dec 4, 2019
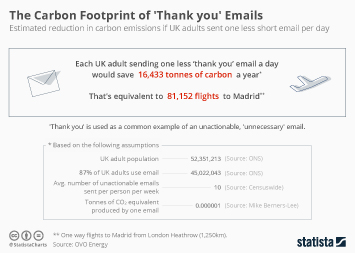
This chart shows the estimated reduction in carbon emissions if UK adults sent one less short email per day.
More Information
Twitter
Dec 3, 2019
This chart shows the number of times @realdonaldtrump tweeted using the following nicknames for selected figures*.
More Information
Music in the U.S.
Dec 3, 2019
This chart shows U.S. album and digital track sales from January to July 2019.
More Information
Credit Card Debt
Dec 3, 2019
This chart shows average per capita credit card debt in the U.S., by state (Q2 2019).
More Information
Sponsored Post
Dec 3, 2019
Regional breakdown of trust in the services sector.
More Information
Climate
Dec 3, 2019
This chart shows the deviation of annual mean surface temperature of the Earth from the 1951-1980 average.
More Information
Firearms
Dec 3, 2019
This chart shows the average price of an M16A2/A4 assault rifle in selected countries/regions in late 2019*.
More Information
Climate Change
Dec 3, 2019
This chart shows the number of weather-related climate disasters that have resulted in people being internally displaced from 2008...
More Information
Rail Travel
Dec 2, 2019
This chart shows a breakdown of how money made via rail fares is spent in Great Britain.
More Information
United Kingdom
Dec 2, 2019
This chart shows the foreign politicians of which the largest share of people in the UK have a positive opinion in 2019.
More Information
Employment
Dec 2, 2019
This chart shows the average annual number of strike days per 1,000 employees in selected OECD countries.
More Information
86
/
161
Contact
Get in touch with us. We are happy to help.
Do you still have questions?
Feel free to contact us anytime using our
contact form
or visit our
FAQ page
.
Your contact to the Infographics Newsroom
Felix Richter
Data Journalist
felix.richter@statista.com
+49 (40) 284 841 557