Skip to main content
Consumer Goods & FMCG
E-Commerce
Economy & Politics
Energy & Environment
Health, Pharma & Medtech
Internet
Media
Technology & Telecommunications
Transportation & Logistics
Travel, Tourism & Hospitality
View all industries
Global data volume growth
Global AI market size
Number of generative AI users worldwide
Global inflation rate
Retail e-commerce sales worldwide
Largest economies worldwide
Biggest social media platforms by users
Global EV market share by manufacturer
International tourist arrivals by world region
Global annual CO₂ emissions
Browse recent statistics
Artificial intelligence (AI) worldwide
TikTok
Nvidia
E-commerce worldwide
Global GDP
Instagram
Apparel market worldwide
Video gaming worldwide
Global renewable energy industry
Influencer marketing worldwide
Browse recent topics
Consumer Trends 2026
Artificial Intelligence: in-depth market analysis
E-commerce challenges
Global economy
TikTok
Luxury goods: in-depth market analysis
Electric vehicles: A global overview
Video gaming worldwide
Travel and tourism trends 2026
Battery recycling worldwide
Browse recent reports
Explore the tool
Explore Classic mode
Advertising & Media
eCommerce
Consumer
Finance
Global Indicators
Health
Industrial
Mobility
Technology
Explore Market Insights
eCommerce Insights
Research AI
Book a demo
All integrations
Developer docs
Explore Statista Connect
Research
Strategy & Consulting
Marketing
Media & PR
Explore AI assistants
Marketing
Research & Development
Strategy
Sales
Find the fact
Tell the story
Win the pitch
Understand the market
Develop your strategy
Academia
Agencies
Consultancies
Consumer goods
Finance
Tech
Research solutions
Strategy consulting
Communication services
Explore Statista+
Statista R
Statista Healthcare
About Statista
First steps & help center
Webinar & training hub
Success stories
Individuals & Small Teams
Businesses & Enterprises
Academia & Government
English
Deutsch
Daily Data
Global stories vividly visualized
Snapchat's user growth
Oct 23, 2019
This chart shows Snapchat's user growth in Q3 since 2014.
More Information
Income Tax
Oct 23, 2019
More Information
Brexit
Oct 23, 2019
This chart shows the share of the UK's public approving of British and EU leadership.
More Information
Renewable Energy
Oct 22, 2019
This chart shows the renewable capacity growth estimates between 2019 and 2024 in gigawatts.
More Information
Hunting
Oct 22, 2019
This chart shows the number of hunters per 1,000 inhabitants in selected European countries in 2018.
More Information
Cristiano Ronaldo
Oct 22, 2019
This chart shows Cristiano Ronaldo's annual Instagram earnings and salary at Juventus in 2019.
More Information
Millionaires
Oct 22, 2019
This chart shows countries by the number of dollar millionaires in 2019.
More Information
United Kingdom
Oct 22, 2019
This flow chart covers potential Brexit scenarios and likely outcomes after the vote on the Brexit deal on 22 October 2019.
More Information
Demographics
Oct 22, 2019
This chart shows UK population mid-year estimates and projections from 1993 to 2043.
More Information
Politics
Oct 22, 2019
This chart shows the seats won in the 2019 Canadian federal election, by party.
More Information
Gun Sales
Oct 22, 2019
This chart shows estimated gun sales per 1,000 adults in U.S. states in 2018.
More Information
Air Travel Emissions
Oct 22, 2019
This chart shows the estimated global share of commercial air travel CO2 emissions in 2018.
More Information
Tech
Oct 21, 2019
This chart shows the percent of people who are optimistic about effects of tech on society.
More Information
World Governments
Oct 21, 2019
This chart shows the share of countries under each regime type, 1946-2017.
More Information
Aviation
Oct 21, 2019
This infographic charts the monthly orders of the Boeing 737 Max.
More Information
UK
Oct 21, 2019
This chart shows public opinion on the Brexit deal negotiated by the Boris Johnson government in October 2019.
More Information
Opioid Crisis
Oct 21, 2019
This chart shows the estimated cost of the U.S. opioid crisis by category from 2015 to 2018.
More Information
Digital Media
Oct 18, 2019
This chart shows the revenue of the digital media market in selected countries in 2023 (in billion U.S. dollars).
More Information
Retail Sales
Oct 18, 2019
This chart shows the percent change in monthly U.S. retail sales growth between 2018 and 2019.
More Information
Christianity
Oct 17, 2019
This chart shows the share of the U.S. population identifying as Christian.
More Information
United Kingdom
Oct 17, 2019
This chart shows public opinion on how UK party leaders are handling Brexit.
More Information
Venture Capital
Oct 17, 2019
This chart shows venture capital funding (in billion USD) by sector in Q3 2019.
More Information
Carbon Tax
Oct 17, 2019
This chart shows the range of estimated percent change in energy prices in 2030 due to carbon tax.
More Information
Netflix
Oct 17, 2019
This chart shows Netflix's subscriber growth broken down by market.
More Information
2020 Presidential Election
Oct 17, 2019
This chart shows how the proposed reform compares with the current tax system by income group.
More Information
United Kingdom
Oct 17, 2019
This flow chart covers potential Brexit scenarios and likely outcomes after the EU summit in October 2019.
More Information
Digital Literacy
Oct 16, 2019
This chart shows the percent of U.S. adults answering each question
More Information
Climate
Oct 16, 2019
This chart shows UK public opinion on the October 2019 Extinction Rebellion protests.
More Information
2020
Oct 16, 2019
This chart shows the minutes spoken in the October 15 televised Democratic debate.
More Information
Presidential Ages
Oct 16, 2019
This chart shows survey responses to the ages and perceived physical fitness of presidential candidates for the 2020 presidential election.
More Information
U.S. Troops Abroad
Oct 15, 2019
This chart shows U.S. troop levels in South Korea and Japan as well as current and potential future contributions to the U.S. military.
More Information
Health
Oct 15, 2019
This chart shows the common types of cancer in England, by gender.
More Information
Charity
Oct 15, 2019
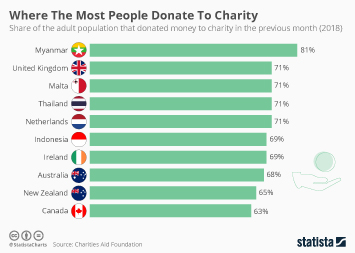
This chart shows the countries in which the largest share of the adult population have donated money to charity in the last month.
More Information
Charity Donations
Oct 15, 2019
This chart shows the share of the adult population that donated money to charity in the previous month (2018).
More Information
Hate Crime
Oct 15, 2019
This chart shows the total number of hate crimes recorded by police in England and Wales.
More Information
Travel
Oct 15, 2019
This chart shows the average estimated waiting times for security checks at large UK airports.
More Information
World Record
Oct 14, 2019
This chart shows the world record marathon progression for women (in hours: minutes: seconds).
More Information
Nobel Prize
Oct 14, 2019
This chart shows the share of immigrants among U.S. winners of Nobel Prizes in the sciences.
More Information
Media Revenue
Oct 14, 2019
This chart shows the television industry revenue in the UK from 2004 to 2018 by source (in billion GBP).
More Information
Competitive Economies
Oct 14, 2019
This chart shows countries ranked by national economic competitiveness in 2019 (100 = most competitive).
More Information
Syria
Oct 14, 2019
This chart shows the share who approve/disapprove of Trump's decision to remove U.S. troops from Syria.
More Information
Global Economic Outlook Score
Oct 14, 2019
This chart shows the balanced satisfaction and outlook scores for the next 6 months
More Information
Space Exploration
Oct 11, 2019
This chart shows the number of discovered moons per planet.
More Information
Carbon Tax
Oct 11, 2019
This chart shows the estimated average percent change in energy prices in 2030 due to a carbon tax.
More Information
Congestion
Oct 11, 2019
This chart shows the most congested cities in Asia.
More Information
Obesity
Oct 11, 2019
This chart shows average annual health expenditure per capita due to obesity from 2020 to 2050.
More Information
Drugs
Oct 11, 2019
This chart shows the estimated daily cocaine consumption based on waste water analysis in selected cities.
More Information
Syria
Oct 11, 2019
This chart shows the population of camps for displaced people in April/May 2019.
More Information
Survey
Oct 10, 2019
This chart shows how having certain pets could affect the willingness of people to date you in the UK.
More Information
Mental Health
Oct 10, 2019
This chart shows the share of GB adults saying their current mental health is in general 'fairly' or 'very' bad, by demographic.
More Information
Electric Mobility
Oct 10, 2019
The advantages and disadvantages of e-scooters in statistics
More Information
Emissions
Oct 9, 2019
This chart shows billion tons of carbon dioxide equivalent produced from 1965 to 2017.
More Information
U.S. Politics
Oct 9, 2019
This chart shows U.S. public opinion on the seriousness of President Trump's phone call to the Ukrainian president.
More Information
U.S. Politics
Oct 9, 2019
This chart shows the share of Americans that support and oppose the impeachment inquiry in October 2019.
More Information
Water Consumption
Oct 9, 2019
This chart shows the average consumption of tap water per person in the EU (litres per day)
More Information
Childhood Obesity
Oct 9, 2019
This chart shows the predicted number of children/adolescents aged 5-19 living with obesity worldwide.
More Information
LGBTQ+ Rights
Oct 9, 2019
This chart shows an overview of U.S. state protections for LGBTQ+ people in the workplace.
More Information
Impeachment
Oct 9, 2019
This chart shows the support among House Representatives for the impeachment inquiry.
More Information
Health Starts
Oct 8, 2019
This chart shows the total amount of fundraising for health startups by health goals in 2019 (in billion USD).
More Information
International Trade
Oct 8, 2019
The exports of olive oil from Spain to countries outside the EU (thousands of tons).
More Information
Syria
Oct 8, 2019
This chart shows Syrian Civil War fatalities documented by Syrian Observatory for Human Rights.
More Information
Firefighter Fatalities
Oct 8, 2019
This chart shows the number of firefighters killed on duty in the U.S. by year.
More Information
Boeing 737 Max
Oct 8, 2019
This chart shows the size of fleet and most orders filled for the Boeing 737 Max by airline affected.
More Information
Working Conditions
Oct 8, 2019
This chart shows the share of U.S. workers satisfied with the following in August 2019.
More Information
Trade Tariffs
Oct 7, 2019
This chart shows the country/region that has placed retaliation tariffs on U.S. goods, by rate and value in billion USD.
More Information
U.S. Military
Oct 7, 2019
This chart shows the count of U.S. military force rated on a scale of 1 to 5.
More Information
Consumption Tax
Oct 7, 2019
This chart shows survey responses concerning the consumption tax hike in Japan in 2019.
More Information
Sport
Oct 7, 2019
This chart shows the results of Manchester United in all competitions with Ole Gunnar Solskjær as manager as of 7 October 2019.
More Information
Space Investment
Oct 7, 2019
This chart shows private and public investment in space over the course of the 21st century.
More Information
Sexual Harassment
Oct 4, 2019
This chart shows the percent who think people are sensitive to the problem of sexual harassment, 1998-2019.
More Information
Marketing
Oct 4, 2019
This chart shows the percent of marketers who believe the following formats are most effective for influencers.
More Information
Biodiversity
Oct 4, 2019
This chart shows key facts about the UK's biodiversity in October 2019.
More Information
Patents
Oct 4, 2019
This chart shows the proportion of female inventors associated with global patent applications.
More Information
Global Economy
Oct 2, 2019
This chart shows the percent that think current economic conditions have worsened compared to six months ago.
More Information
Internet services in China
Oct 2, 2019
This chart shows how dominant Chinese internet companies are in their home market.
More Information
Income
Oct 2, 2019
This chart shows an overview of U.S. median income by state for 2018.
More Information
Wine Imports
Oct 2, 2019
The top wine importing countries in the world in 2018, by volume in millions of gallons.
More Information
China
Oct 2, 2019
This chart shows the developments of exports from and imports to China between 1960 and 2018.
More Information
Patent Applications
Oct 2, 2019
This chart shows the proportion of female inventors in patent applications from 1998 to 2017.
More Information
Rural Health
Oct 1, 2019
This chart shows the number of U.S. rural hospital closures per year.
More Information
Vegans & Vegetarians
Oct 1, 2019
This chart shows responses to "in terms of eating preferences, do you consider yourself vegan, vegetarian?"
More Information
Vegetarianism
Oct 1, 2019
This chart shows the countries with the biggest increase of the vegetarian population between 2016 and 2017.
More Information
Defense Spending
Oct 1, 2019
This chart shows research and development budget by company in 2018 (in billion USD).
More Information
Military Spending
Oct 1, 2019
% change in military spending among major powers between 2009 and 2018.
More Information
In Profile
Oct 1, 2019
This chart is a profile of the life of Mahatma Gandhi.
More Information
Super Rich
Oct 1, 2019
This chart shows the number of ultra-high-net-worth individuals per million adults in 2018.
More Information
Work & Travel
Sep 30, 2019
Thic chart shows countries that are part of Australia's work and travel program and the year they joined.
More Information
European Union
Sep 30, 2019
This chart shows the UK contribution to the EU budget in 2018.
More Information
Electric Vehicles
Sep 30, 2019
This chart shows electric vehicle sales in China from January to August 2019.
More Information
Forever 21 Bankruptcy
Sep 30, 2019
Thic chart shows the percentage of teenagers in the U.S. naming Forever 21 as their favorite clothing brand between 2002 and 2019.
More Information
89
/
161
Contact
Get in touch with us. We are happy to help.
Do you still have questions?
Feel free to contact us anytime using our
contact form
or visit our
FAQ page
.
Your contact to the Infographics Newsroom
Felix Richter
Data Journalist
felix.richter@statista.com
+49 (40) 284 841 557