Skip to main content
Consumer Goods & FMCG
E-Commerce
Economy & Politics
Energy & Environment
Health, Pharma & Medtech
Internet
Media
Technology & Telecommunications
Transportation & Logistics
Travel, Tourism & Hospitality
View all industries
Global data volume growth
Global AI market size
Number of generative AI users worldwide
Global inflation rate
Retail e-commerce sales worldwide
Largest economies worldwide
Biggest social media platforms by users
Global EV market share by manufacturer
International tourist arrivals by world region
Global annual CO₂ emissions
Browse recent statistics
Artificial intelligence (AI) worldwide
TikTok
Nvidia
E-commerce worldwide
Global GDP
Instagram
Apparel market worldwide
Video gaming worldwide
Global renewable energy industry
Influencer marketing worldwide
Browse recent topics
Consumer Trends 2026
Artificial Intelligence: in-depth market analysis
E-commerce challenges
Global economy
TikTok
Luxury goods: in-depth market analysis
Electric vehicles: A global overview
Video gaming worldwide
Travel and tourism trends 2026
Battery recycling worldwide
Browse recent reports
Explore the tool
Explore Classic mode
Advertising & Media
eCommerce
Consumer
Finance
Global Indicators
Health
Industrial
Mobility
Technology
Explore Market Insights
eCommerce Insights
Research AI
Book a demo
All integrations
Developer docs
Explore Statista Connect
Research
Strategy & Consulting
Marketing
Media & PR
Explore AI assistants
Marketing
Research & Development
Strategy
Sales
Find the fact
Tell the story
Win the pitch
Understand the market
Develop your strategy
Academia
Agencies
Consultancies
Consumer goods
Finance
Tech
Research solutions
Strategy consulting
Communication services
Explore Statista+
Statista R
Statista Healthcare
About Statista
First steps & help center
Webinar & training hub
Success stories
Individuals & Small Teams
Businesses & Enterprises
Academia & Government
English
Deutsch
Daily Data
Infographics on the topic "coronavirus"
Chinese New Year
Jan 20, 2023
Change in travel behavior during the Lunar New Year holiday period in China (2019 to 2023).
More Information
China
Jan 17, 2023
This chart shows China's real GDP growth since 1980.
More Information
Face Masks
Jan 12, 2023
This chart shows estimated global face mask unit sales and revenue.
More Information
Trusted Professions
Jan 11, 2023
This chart shows the share of U.S. respondents rating the honesty/ethical standards of the following professions as high/low.
More Information
Covid-19 in China
Jan 9, 2023
This chart shows independently forecast and officially reported daily new Covid-19 cases and deaths in Mainland China on selected dates...
More Information
Publication sponsorisée par Booking.com
Jan 9, 2023
Cette infographie montre le ressenti des hôteliers européens vis-à-vis des principaux sujets relatifs au secteur de l'hébergement.
More Information
Sponsored post by Booking.com
Jan 5, 2023
This infographic shows the number of room nights booked in Australia from 2017 to 2021.
More Information
social progress index
Jan 2, 2023
This chart shows which countries saw the biggest changes on the Social Progress Index between 2011 and 2022.
More Information
Influenza
Dec 16, 2022
This chart shows the rate of flu and covid admissions to hospitals in late 2022.
More Information
Sponsored post by Booking.com
Dec 12, 2022
This infographic shows the number of international tourist arrivals by destination region from 1990 to 2021
More Information
Sponsored post by Booking.com
Dec 6, 2022
This graphic shows European hoteliers' sentiments towards some key topics.
More Information
Asia
Dec 1, 2022
This chart shows the number of mass demonstrations and main cities involved in China from Nov. 26 to 28, 2022, by province/autonomous...
More Information
Covid
Nov 29, 2022
This chart shows the number of daily Covid infections in mainland China in 2022.
More Information
Thanksgiving
Nov 24, 2022
This chart shows the average price of a ten-person Thanksgiving dinner in the U.S. from 1990 to 2022.
More Information
GAMAM two years into the pandemic
Nov 10, 2022
This chart shows revenue growth for selected tech companies in the first nine months of 2021.
More Information
2022 Midterms
Nov 9, 2022
This chart shows early/mail-in and total votes cast in presidential and midterm elections in the U.S.
More Information
cost of living crisis
Nov 7, 2022
This chart shows the share of Londoners that did not have at least £1,500, right before the cost of living crisis.
More Information
Stress Awareness Month
Nov 7, 2022
This chart shows the things causing most stress for Americans in 2022.
More Information
Covid-19 Vaccination
Nov 2, 2022
This video recounts the global Covid-19 vaccine rollout by continent.
More Information
U.S. Midterm elections
Oct 27, 2022
This chart shows the key issues for U.S. voters that will influence who they vote for in the midterm elections.
More Information
Education
Oct 24, 2022
This chart shows the share of countries undertaking studies to evaluate the effects of the pandemic on education.
More Information
Chinese Exports
Oct 24, 2022
This chart shows the share of global exports originating from China, by selected product category.
More Information
Education
Oct 24, 2022
This chart shows the share of fourth and eighth graders in the United States, who are proficient in mathematics.
More Information
Loneliness
Oct 19, 2022
This chart shows which UK local authority supergroups had the greatest share of severely lonely people in the pandemic.
More Information
Crude Oil
Oct 19, 2022
This chart shows global crude oil production by region (1998-2021).
More Information
Oil & Gas
Oct 19, 2022
This chart shows the number of global oil and gas lease rounds, by year of award.
More Information
Life Expectancy
Oct 18, 2022
This chart shows the change in life expectancy in selected countries between 2019 and 2021 (in months).
More Information
Publication sponsorisée
Oct 18, 2022
Cette infographie montre que le tourisme international pré-Covid progressait plus vite que le tourisme national dans l'UE.
More Information
Artículo patrocinado
Oct 14, 2022
Esta infografía muestra que el crecimiento del turismo internacional pre-COVID-19 en Europa superó al doméstico.
More Information
inflation
Oct 13, 2022
This chart shows which issues people are most worried about globally as of September 2022.
More Information
Freight Forwarding
Oct 11, 2022
This chart shows the top 8 logistics companies worldwide in the air freight sector by volume of cargo (in million tons).
More Information
Travel
Oct 10, 2022
This chart shows the share of 2019 air passenger numbers achieved/projected between 2021 and 2024, by continent (in percent).
More Information
Logistics
Oct 7, 2022
This chart shows parcel shipping volume worldwide and in selected countries in 2021.
More Information
Federal Agencies
Oct 7, 2022
This chart shows the share of Americans who rate the job done by the following federal agencies as excellent/good (September 2022).
More Information
National Debt
Oct 5, 2022
This chart shows general government debt as a share of GDP in 1995 and 2020 in selected countries (in percent).
More Information
Sponsored post
Sep 26, 2022
This infographic compares the leading countries by tourist arrivals in 2019 and 2020
More Information
Publication sponsorisée
Sep 26, 2022
Cette infographie compare les principaux pays d'accueil de touristes internationaux en 2019 et 2020.
More Information
Publication sponsorisée
Sep 26, 2022
Cette infographie présente les prévisions de reprise post-Covid pour les hôtels et locations de courte durée jusqu'en 2025.
More Information
Artículo patrocinado
Sep 26, 2022
Esta infografía compara los principales países por llegadas de turistas en 2019 y 2020.
More Information
Sponsored post
Sep 23, 2022
This infographic shows the value of international tourist receipts in 2019 and 2020 by country of destination.
More Information
Publication sponsorisée
Sep 20, 2022
Cette infographie montre l'impact du Covid-19 sur le tourisme européen.
More Information
Artículo patrocinado
Sep 19, 2022
Esta infografía muestra el impacto sin precedentes del COVID-19 en el turismo
More Information
Covid-19 Pandemic
Sep 15, 2022
This chart shows the number of weekly Covid-19 deaths worldwide since January 2020.
More Information
Uber-Taxi Alliance
Sep 13, 2022
This chart shows taxis and ride-sharing use in New York City
More Information
Covid in China
Sep 5, 2022
This chart shows daily new coronavirus cases in China and biggest cities in lockdown.
More Information
Restaurants
Sep 2, 2022
This chart shows the U.S. fast-casual dining chains with the highest sales numbers in 2021.
More Information
Restaurant Sales
Sep 2, 2022
This chart shows the year-over-year change in monthly restaurant sales in the United States (in percent).
More Information
World Affairs
Aug 24, 2022
This chart shows worldwide Google News search interest for 'Ukraine' from February 1 to August 20, 2022.
More Information
Video-on-Demand
Aug 19, 2022
This chart shows the penetration rate of video-on-demand services around the world in 2022.
More Information
pandemic
Aug 18, 2022
This chart shows how likely people in OECD countries think it is that their government would be prepared for another pandemic.
More Information
Manufacturing
Aug 16, 2022
This chart shows how often onshoring buzzwords were mentioned in earnings calls and presentations of U.S. public companies.
More Information
Video streaming services
Aug 15, 2022
This chart shows the share of respondents with the following number of paid streaming subscriptions in 2019/2022.
More Information
remote working
Aug 3, 2022
This chart shows which new policies have been adopted by UK FinTech startups in 2022.
More Information
Bewery Boom
Aug 2, 2022
This chart shows the number of breweries in the U.S. from 1976 to 2021.
More Information
covid
Aug 1, 2022
This chart shows the share of parents that would or would not get their children under 5 vaccinated against Covid.
More Information
aviation
Jul 29, 2022
This chart shows which airports had the most delays of scheduled flights between May 26 - July 19, 2022.
More Information
Covid-19 vaccine rollout
Jul 27, 2022
This chart shows the number of facilities able to manufacture mRNA vaccines outside of the EU/USA/CAN.
More Information
covid
Jul 21, 2022
This chart shows how European Covid cases are on the rise once more in the summer of 2022.
More Information
EU population decline
Jul 15, 2022
This chart shows how the EU's population declined for the second consecutive year, mostly due to Covid.
More Information
Inflation
Jul 13, 2022
This chart shows the year-over-year change in the price of selected items on the Consumer Price Index (June 2021-June 2022).
More Information
july 4
Jul 4, 2022
This chart shows the number of flights that were delayed or canceled over the July 4 weekend, 2022.
More Information
covid policy
Jul 1, 2022
This chart shows the latest return to work policies for Big Tech companies, as of June 2022.
More Information
WHO Funding
Jun 24, 2022
This chart shows assessed contributions to the World Health Organization for 2022.
More Information
EU Debt
Jun 23, 2022
This chart displays the EU countries with the highest gross government debt as share of GDP in 2021.
More Information
The Super-Rich
Jun 17, 2022
This chart shows the net wealth held by top 1 percent of the wealthiest people in selected countries.
More Information
Profits
Jun 2, 2022
This chart shows large companies (revenues of $12b+) with the highest losses as a share of revenue in 2021.
More Information
Inflation
Jun 1, 2022
This chart shows the monthly reading of the consumer price index for selected countries.
More Information
Firearms in America
May 30, 2022
This chart shows the number of firearm background checks in the United States.
More Information
Travel amid the Covid-19 pandemic
May 25, 2022
This chart shows which measures Americans consider essential to safe travel during the Covid-19 pandemic.
More Information
Remote Work
May 24, 2022
This chart shows the share of employed persons (16+) in the U.S. who worked remotely in the last 4 weeks due to the Covid-19 pandemic.
More Information
Economics
May 20, 2022
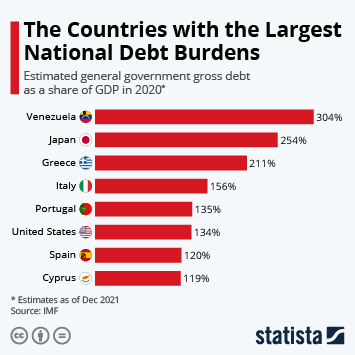
This chart shows the countries with the largest estimated general government gross debt as a share of GDP in 2020.
More Information
Cyberspace
May 16, 2022
This chart shows financial losses suffered by victims of internet crimes reported to the FBI.
More Information
Chinese Economy
May 16, 2022
This chart shows the year-over-year change in monthly Chinese retail sales and Chinese industrial production (in percent).
More Information
Covid-19 in the U.S.
May 13, 2022
This chart shows the cumulative number of Covid-19 deaths in the United States.
More Information
Coronavirus pandemic
May 4, 2022
This chart shows the development of the Oxford Containment and Health Index over time.
More Information
Covid-19 cases by country
May 3, 2022
This animated chart shows the countries with the highest number of Covid-19 cases from January 2020 through April 2022.
More Information
Container Shipping
Apr 29, 2022
This chart shows the world's biggest container ports in 2005 and 2021 by shipping volume.
More Information
Social Media
Apr 26, 2022
This chart shows the average time spent connected to social networks during a typical day in 2021 (hh:mm).
More Information
Global book market
Apr 21, 2022
This chart shows the worldwide estimated revenue with eBooks and physical books.
More Information
Politics
Apr 19, 2022
This chart shows the change in approval rating of U.S. President Biden from 2021 to 2022, by generation group.
More Information
Home office & remote work
Apr 8, 2022
This chart shows the countries with the highest estimated collaboration software revenues in 2022.
More Information
Retail
Mar 30, 2022
This chart shows GameStop's revenue per fiscal year by product category.
More Information
FT1000
Mar 25, 2022
This chart shows the companies in Europe with the largest revenue compound annual growth rates (CAGR) from 2017 to 2020.
More Information
Future of Work
Mar 23, 2022
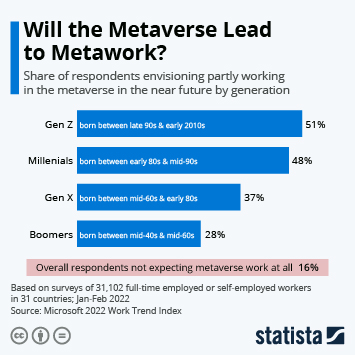
This chart shows the share of respondents envisioning partly working in the metaverse in the near future by generation.
More Information
Coronavirus
Mar 23, 2022
This chart shows the viral lineage of newly detected Covid-19 infections in the U.S. per week (as of March 19, 2022, in percent).
More Information
Virtual reality & video games
Mar 16, 2022
This chart shows the share of respondents who played a proto-metaverse game/a video game in general in the past six months.
More Information
European Car Manufacturers
Mar 16, 2022
This chart shows the biggest publicly traded European automakers by market cap.
More Information
Wealth Disparity in the United States
Mar 15, 2022
This chart shows the change in wealth of U.S. billionaires since the start of the pandemic.
More Information
Covid-19
Mar 11, 2022
This chart shows the global 7-day-rolling average of newly confirmed Covid-19 cases from 2020 to 2022.
More Information
Coronavirus impact on the workforce
Mar 4, 2022
This chart shows the share of U.S. workers considering downshifting or leaving the workforce in 2020.
More Information
4
/
15
Contact
Get in touch with us. We are happy to help.
Do you still have questions?
Feel free to contact us anytime using our
contact form
or visit our
FAQ page
.
Your contact to the Infographics Newsroom
Felix Richter
Data Journalist
felix.richter@statista.com
+49 (40) 284 841 557