Skip to main content
Consumer Goods & FMCG
E-Commerce
Economy & Politics
Energy & Environment
Health, Pharma & Medtech
Internet
Media
Technology & Telecommunications
Transportation & Logistics
Travel, Tourism & Hospitality
View all industries
Global data volume growth
Global AI market size
Number of generative AI users worldwide
Global inflation rate
Retail e-commerce sales worldwide
Largest economies worldwide
Biggest social media platforms by users
Global EV market share by manufacturer
International tourist arrivals by world region
Global annual CO₂ emissions
Browse recent statistics
Artificial intelligence (AI) worldwide
TikTok
Nvidia
E-commerce worldwide
Global GDP
Instagram
Apparel market worldwide
Video gaming worldwide
Global renewable energy industry
Influencer marketing worldwide
Browse recent topics
Consumer Trends 2026
Artificial Intelligence: in-depth market analysis
E-commerce challenges
Global economy
TikTok
Luxury goods: in-depth market analysis
Electric vehicles: A global overview
Video gaming worldwide
Travel and tourism trends 2026
Battery recycling worldwide
Browse recent reports
Explore the tool
Explore Classic mode
Advertising & Media
eCommerce
Consumer
Finance
Global Indicators
Health
Industrial
Mobility
Technology
Explore Market Insights
eCommerce Insights
Research AI
Book a demo
All integrations
Developer docs
Explore Statista Connect
Research
Strategy & Consulting
Marketing
Media & PR
Explore AI assistants
Marketing
Research & Development
Strategy
Sales
Find the fact
Tell the story
Win the pitch
Understand the market
Develop your strategy
Academia
Agencies
Consultancies
Consumer goods
Finance
Tech
Research solutions
Strategy consulting
Communication services
Explore Statista+
Statista R
Statista Healthcare
About Statista
First steps & help center
Webinar & training hub
Success stories
Individuals & Small Teams
Businesses & Enterprises
Academia & Government
English
Deutsch
Daily Data
Infographics on the topic "coronavirus"
Russian Billionaires
Mar 4, 2022
This chart shows selected Russian billionaires' net worth losses since Feb 23 2022.
More Information
Covid-19
Mar 1, 2022
This chart shows the share of the population in African countries that have had at least one Covid-19 vaccine dose.
More Information
Smartphones
Mar 1, 2022
This chart ranks the countries with the highest number of smartphone users.
More Information
Energy prices
Feb 25, 2022
This chart shows the EU countries with the highest share of residents unable to properly heat their homes.
More Information
Oil Price
Feb 24, 2022
This chart shows the daily price per barrel of WTI crude oil (in U.S. dollars).
More Information
Supercomputers
Feb 17, 2022
The chart ranks the eight fastest supercomputers in the world based on their maximum computing power.
More Information
Online dating
Feb 11, 2022
This chart shows the monthly downloads of Tinder by region.
More Information
Society
Feb 9, 2022
This chart shows the countries where belief in a "Covid myth" conspiracy is most widespread.
More Information
Covid-19 vaccines
Feb 9, 2022
This chart shows the global progress towards the WHO goal of having 70% of the population fully vaccinated by mid-2022.
More Information
Pfizer
Feb 9, 2022
This chart shows Pfizer's annual revenue since 2016.
More Information
Covid-19 Pandemic
Feb 8, 2022
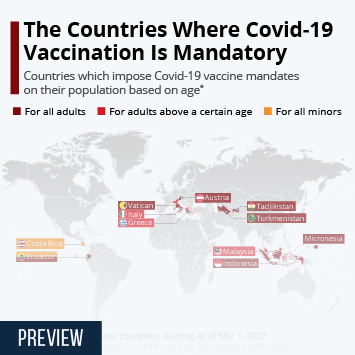
This chart shows the countries which impose Covid-19 vaccine mandates on their population based on age (as of Feb 7, 2022).
More Information
Live Music Industry
Feb 2, 2022
This chart shows the share of respondents who bought music event tickets in the last 12 months.
More Information
Economic Recovery
Jan 31, 2022
This chart shows the change in nonfarm payrolls in between February 2020 and December 2021, by state.
More Information
Pharma Market
Jan 28, 2022
This chart shows the estimated worldwide revenue of cancer drugs and market share in overall drug sales.
More Information
COVID-19 Pandemic
Jan 27, 2022
This chart shows the seven-day moving average of newly confirmed COVID-19 cases worldwide, by WHO region.
More Information
Covid-19 Vaccines
Jan 27, 2022
This chart shows the number of Covid-19 vaccine doses administered per 100 people at the end of the respective month, by country income...
More Information
Food spending habits
Jan 26, 2022
This chart shows the delivery service types used in the U.S. in the past 12 months.
More Information
U.S. Workforce
Jan 21, 2022
This chart shows the estimated number of U.S. workers missing work due to coronavirus.
More Information
American Outlook on the COVID-19 Pandemic
Jan 21, 2022
This chart shows the share of Americans expressing optimism with respect to the COVID-19 situation in the U.S.
More Information
Public opinion
Jan 20, 2022
This chart shows trustworthy and untrustworthy types of organizations.
More Information
Business
Jan 19, 2022
This chart shows levels of trust in business by country in 2021.
More Information
Economy outlook
Jan 19, 2022
This chart shows the most relevant business risks in 2022.
More Information
COVID Tests
Jan 19, 2022
This chart shows the percent of U.S. government web traffic, by webpage (on Jan 18, 2022 at 1 p.m. EST).
More Information
Covid-19 Vaccines
Jan 18, 2022
This chart shows the share of the population in selected countries which has received a coronavirus vaccine booster shot (as of Jan...
More Information
COVAX Initiative
Jan 18, 2022
This chart shows the percent gap in allocated and delivered Covid-19 vaccine doses and the number of total allocated doses through...
More Information
Omicron Wave
Jan 14, 2022
This chart shows the share of ICU beds in use in U.S. hospitals registered with HHS (as of Jan 13, 2022).
More Information
Media
Jan 13, 2022
This chart shows the most important revenue streams in journalism.
More Information
International Trade
Jan 13, 2022
This chart shows the share of global payments made in U.S. dollar and Euro (based on transaction value).
More Information
fatal work
Jan 13, 2022
This chart shows the Number of deaths on the job per 100,000 full-time equivalent workers.
More Information
Coronavirus vaccines
Jan 13, 2022
More Information
Coid-19 Hospitalizations
Jan 11, 2022
This chart shows the rate of hospitalization for Covid-19 in the U.S. among children in 2021/22 (per 100,000 of population).
More Information
Gross Domestic Product
Jan 7, 2022
This chart shows the GDP change in selected OECD countries between Q4 2019 and Q3 2021.
More Information
S&P 500
Jan 7, 2022
This chart shows the best and worst performing sectors on the S&P 500 in 2021.
More Information
Covid-19
Dec 22, 2021
This chart compares worldwide Covid-19 deaths in 2021 compared to global TB, HIV and Malaria deaths in 2020.
More Information
Covid-19 Variants
Dec 21, 2021
This chart shows the estimated share of new Covid-19 cases in the United States, by variant.
More Information
Covid-19 vaccines
Dec 17, 2021
This chart shows the cumulative number of Covid-19 vaccine doses produced worldwide by the end of the respective months.
More Information
Society
Dec 9, 2021
This chart shows the average level of happiness in the UK from 2015 to 2021.
More Information
Disease Outbreaks
Dec 9, 2021
This chart shows countries/territories ranked by ability to respond to an epidemic/pandemic in 2021.
More Information
Health
Dec 8, 2021
This chart shows the share of the world population fully-vaccinated against Covid-19, by region in December 2021.
More Information
Survey
Dec 7, 2021
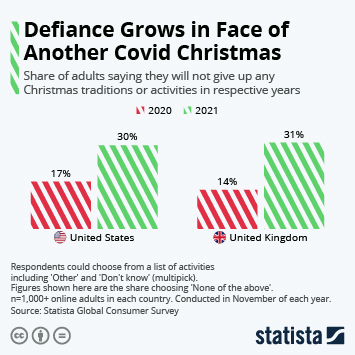
This chart shows the share of adults saying they will not give up any Christmas traditions or activities in 2020 and 2021.
More Information
Covid-19 Vaccines
Dec 6, 2021
This chart shows the cumulative number of first doses/booster doses of Covid-19 vaccines given in the U.S. since September 24, 2021.
More Information
Company Profits
Dec 3, 2021
This chart shows the quarterly operation profits of Samsung (in billion U.S. dollars).
More Information
Coronavirus pandemic
Nov 30, 2021
This chart shows the general issues seen as most pressing during the pandemic.
More Information
Holiday Shopping Channels
Nov 25, 2021
This chart shows how Americans expect to spend their holiday budget across different channels.
More Information
Leadership during the coronavirus pandemic
Nov 24, 2021
This chart shows the countries exhibiting good leadership skills during the coronavirus pandemic.
More Information
Evictions
Nov 23, 2021
This chart shows the number of eviction filings tracked in selected cities before and after the end of the CDC moratorium (2021).
More Information
Thanksgiving
Nov 23, 2021
This chart shows the change in the number of Americans traveling for the Thanksgiving holiday in 2020 and 2021 (forecast) compared...
More Information
Coronavirus Vaccinations
Nov 22, 2021
This chart shows the share of people fully vaccinated against COVID-19 in selected countries (as of Nov 21, 2021).
More Information
Covid-19 Outbreak
Nov 22, 2021
This chart shows the share of the population fully vaccinated against Covid-19 as of Nov 21. 2021.
More Information
Budget 2021
Nov 19, 2021
This chart shows UK public sector net borrowing as a share of GDP since 1900.
More Information
WFP Emergency Plan
Nov 17, 2021
This chart shows the World Food Programme $6.6b plan to prevent famines worldwide for one year, by country of allocation.
More Information
Commuting
Nov 15, 2021
This chart shows the change in attitudes about commuting by car since the start of the pandemic in Australia and New Zealand.
More Information
Pharma Companies
Nov 15, 2021
This chart shows the net income/profit of selected pharma companies in Q1-Q3 2021 and Q1-Q3 2020 (in billion U.S. dollars).
More Information
COVID-19
Nov 10, 2021
This infographic shows the weekly rates per 100,000 people of COVID-19 cases in selected age groups in the U.S., by vaccination status.
More Information
CO₂ Emissions
Nov 4, 2021
This chart shows the annual change in global energy-related CO₂ emissions as well as the make-up of the emissions reduced in 2021.
More Information
Nintendo, Microsoft & Sony
Nov 4, 2021
This chart shows the estimated lifetime sales of current-gen consoles by market.
More Information
COVID-19 Vaccination
Nov 3, 2021
This chart shows the share of employed Americans who said their employer encourages/requires vaccination against COVID-19.
More Information
Politics
Nov 2, 2021
This chart shows President Biden job approval and the share of U.S. adults saying the country is headed in the wrong direction in 2021.
More Information
Deaths from COVID-19
Nov 1, 2021
This chart shows cumulative confirmed coronavirus deaths, by world region (as of Oct 31, 2021).
More Information
Fear
Oct 28, 2021
This chart shows the fears most commonly cited by Americans (saying they made them "afraid" or "very afraid").
More Information
Journalism Market
Oct 27, 2021
This chart shows the favored platforms for local topics according to Reuters Institute.
More Information
COVID-19 Vaccines
Oct 26, 2021
This chart shows the share of global COVID-19 vaccine doses given out by country/continent and those countries'/continents' share of...
More Information
Shipping
Oct 25, 2021
This chart shows the end-to-end transit time for China-U.S. ocean freight (in days).
More Information
E-Mobility
Oct 22, 2021
This chart shows the year-to-date market share of cars registered in the EU by fuel type.
More Information
Mobility Worldwide
Oct 22, 2021
This chart shows the revenue of short-term shared mobility services worldwide.
More Information
COVID-19 Lockdowns
Oct 21, 2021
This chart shows the areas with the longest cumulative pandemic lockdowns.
More Information
Art Auctions
Oct 19, 2021
This chart shows the most expensive Banksy artworks sold at auction.
More Information
Video Streaming
Oct 13, 2021
This chart shows the most watched Netflix shows in first 28 days since release.
More Information
Culture & Community
Oct 12, 2021
This chart shows the top 10 neighborhoods ranked by food, culture and community.
More Information
Health
Oct 11, 2021
This chart gives a breakdown of the people reporting Long Covid symptoms in the UK in 2021.
More Information
Trust in Social Media
Oct 8, 2021
This chart shows the top reasons not to use Facebook for U.S. residents.
More Information
Coronavirus & Air Travel
Oct 8, 2021
This chart shows the COVID-19 relief for airlines by region.
More Information
Coal
Oct 6, 2021
This chart shows the countries generating the biggest shares of their electricity from coal, in percent (2020 or latest available).
More Information
OPEC
Oct 1, 2021
This chart shows the revenue generated by petroleum and other exports in OPEC countries from 1960 until 2020.
More Information
Mobile Data Usage
Sep 30, 2021
This chart shows the countries with highest percentage of users with unlimited mobile data plans.
More Information
Economy
Sep 30, 2021
This chart shows the UK quarterly real GDP index from Q1 2008 to Q2 2021.
More Information
Social Media Usage
Sep 28, 2021
This chart shows the percentage of TikTok users in the last 12 months by country.
More Information
Abortion
Sep 24, 2021
This chart shows the change in the share of people supporting abortion in selected countries between 2014 and 2021.
More Information
News on social media
Sep 23, 2021
This chart shows the most popular social media sites for news.
More Information
Record Companies
Sep 22, 2021
This chart shows the global digital and physical revenue market share of largest record companies.
More Information
Society
Sep 20, 2021
This chart shows conceptions per 1,000 women aged 15-17 in England & Wales in 2020, by region.
More Information
Chuseok Fall Festival
Sep 16, 2021
This chart shows answers among South Korean office workers about plans for the Chuseok fall festival (2021).
More Information
Foreign Direct Investment
Sep 14, 2021
This chart shows FDI inflow and contribution of capital inflows to capital formation in India (in billion U.S. dollars).
More Information
Communicable diseases
Sep 14, 2021
The chart shows tuberculosis treatments and HIV tests in millions in countries supported by the Global Fund.
More Information
Health
Sep 13, 2021
This chart shows Covid-19 related deaths in England in 2021 by vaccination status.
More Information
Economy
Sep 10, 2021
This chart shows the UK GDP monthly index from 2007 to 2021.
More Information
Mental Health
Sep 9, 2021
This chart shows the number of suicides per 100,000 population in 2020 in England and Wales, by region.
More Information
Paralympic Games
Sep 9, 2021
This chart shows the medal count for Paralympic Games 2021.
More Information
Work in India
Sep 8, 2021
This chart shows average annual salary increases in India (in percent).
More Information
COVID-19
Sep 3, 2021
This chart shows deaths attributed to COVID-19 by U.S. state in the past 28 days (as of Sep 3, 2021).
More Information
5
/
15
Contact
Get in touch with us. We are happy to help.
Do you still have questions?
Feel free to contact us anytime using our
contact form
or visit our
FAQ page
.
Your contact to the Infographics Newsroom
Felix Richter
Data Journalist
felix.richter@statista.com
+49 (40) 284 841 557